Here are the essential concepts you must grasp in order to answer the question correctly.
Phase Diagram
A phase diagram is a graphical representation that shows the phases of a substance as a function of temperature and pressure. It illustrates the boundaries between different phases, such as solid, liquid, and gas, and indicates the conditions under which these phases coexist. In the context of solutions, phase diagrams can also depict the effects of solutes on the boiling and freezing points of solvents.
Recommended video:
Phase Changes in Diagrams
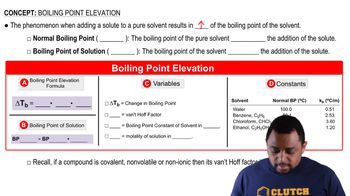
Boiling Point and Vapor Pressure
The boiling point of a liquid is the temperature at which its vapor pressure equals the external pressure surrounding the liquid. When a solute is added to a solvent, it typically lowers the vapor pressure of the solution compared to the pure solvent, which in turn raises the boiling point. This phenomenon is known as boiling point elevation and is crucial for understanding how solutes affect the boiling point of a solvent.
Recommended video:
Volatile vs. Nonvolatile Solutes
Volatile solutes have significant vapor pressures and can evaporate easily, while nonvolatile solutes have negligible vapor pressures and do not contribute to the vapor phase. In a solution, the presence of a nonvolatile solute will lower the vapor pressure more than a volatile solute at the same concentration, affecting the phase behavior and boiling point of the solution. Understanding these differences is essential for interpreting phase diagrams.
Recommended video:

 Verified step by step guidance
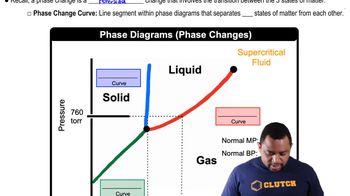
 03:22
03:22