Here are the essential concepts you must grasp in order to answer the question correctly.
Function Transformation
Function transformation refers to the changes made to the graph of a function based on modifications to its equation. Common transformations include vertical shifts, horizontal shifts, reflections, and stretches or compressions. In this case, the function g(x) = f(x) - 1 represents a vertical shift of the graph of f(x) downward by 1 unit.
Recommended video:
Domain & Range of Transformed Functions
Graphing Functions
Graphing functions involves plotting points on a coordinate plane to visually represent the relationship between the input (x-values) and output (y-values) of a function. Understanding how to read and interpret graphs is crucial for analyzing functions and their transformations. The graph of g(x) will be derived from the graph of f(x) by applying the identified transformation.
Recommended video:
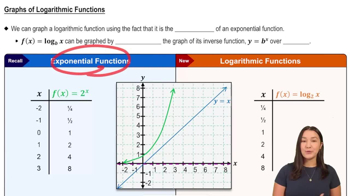
Graphs of Logarithmic Functions
Identifying Key Points
Identifying key points on a graph, such as intercepts and vertices, is essential for accurately sketching the function. In the provided graph of f(x), the points (-3, 0), (3, 0), and (0, -9) are significant as they indicate where the graph intersects the x-axis and the y-axis. These points will also be adjusted according to the transformation to find corresponding points on the graph of g(x).
Recommended video:
Identifying Intervals of Unknown Behavior


