Here are the essential concepts you must grasp in order to answer the question correctly.
Function Transformation
Function transformation refers to the process of altering the graph of a function through various operations, such as stretching, compressing, or shifting. In this case, the function g(x) = ½ f(x) represents a vertical compression of the original function f(x) by a factor of ½, meaning that all y-values of f(x) are halved.
Recommended video:
Domain & Range of Transformed Functions
Graphing Linear Functions
Graphing linear functions involves plotting points that satisfy the function's equation and connecting them to form a straight line. For the function g(x) = ½ f(x), since f(x) is a horizontal line at y = -3, the graph of g(x) will also be a horizontal line, but at y = -1.5, reflecting the vertical compression.
Recommended video:
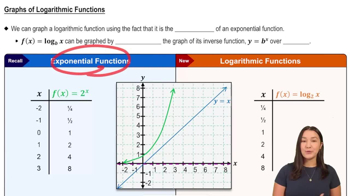
Graphs of Logarithmic Functions
Horizontal and Vertical Lines
Horizontal lines have a constant y-value and are represented by equations of the form y = k, where k is a constant. Vertical lines have a constant x-value and are represented by equations of the form x = h. In this problem, the original function f(x) is a horizontal line, and the transformation to g(x) maintains this horizontal nature while changing the y-value.
Recommended video:


