Here are the essential concepts you must grasp in order to answer the question correctly.
Quadratic Functions
A quadratic function is a polynomial function of degree two, typically expressed in the form y = ax^2 + bx + c. The graph of a quadratic function is a parabola, which can open upwards or downwards depending on the sign of the coefficient 'a'. Understanding the shape and properties of parabolas is essential for graphing quadratic equations.
Recommended video:
Solving Quadratic Equations Using The Quadratic Formula
Vertex of a Parabola
The vertex of a parabola is the highest or lowest point on the graph, depending on its orientation. For the function y = x^2 - 2, the vertex can be found at the point (0, -2), which is derived from the standard form of the quadratic equation. The vertex plays a crucial role in determining the graph's symmetry and overall shape.
Recommended video:
Graphing Points
Graphing points involves plotting specific values of x and their corresponding y values on a coordinate plane. In this case, substituting x values from -3 to 3 into the equation y = x^2 - 2 allows us to find the corresponding y values, which can then be plotted to visualize the quadratic function. This process is fundamental for accurately representing the function's behavior.
Recommended video:
Graphing Equations of Two Variables by Plotting Points

 This video solution was recommended by our tutors as helpful for the problem above.
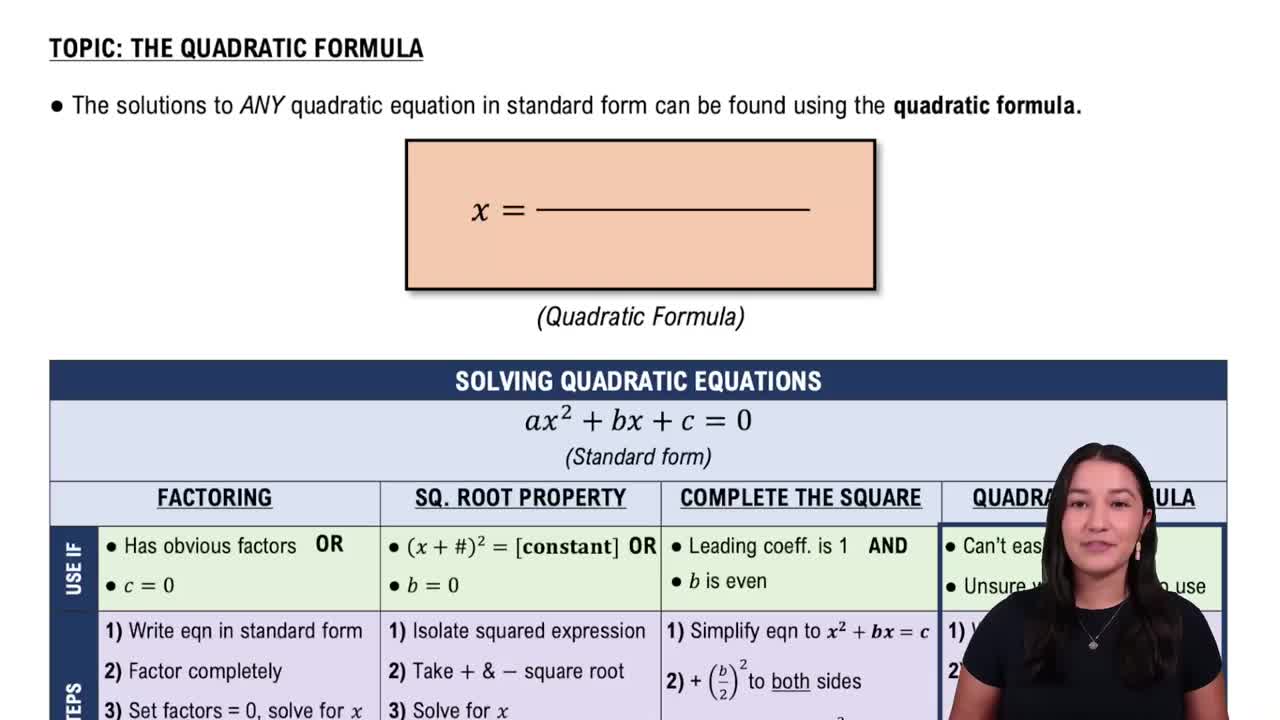
 06:36
06:36
