Hey, everyone. Earlier when graphing exponential functions, we found and plotted a bunch of different ordered pairs, and we found that our graph had similarities to both polynomial and rational functions as we approached an asymptote. Now we're faced with graphing another type of function, a logarithmic function, and you may be dreading having to learn how to graph yet another different type of function. But I have great news for you here because graphing a log function is actually super similar to graphing an exponential function because a log is the inverse of an exponential. So here, I'm going to walk you through graphing a log function using exclusively things we already know about graphing exponential functions. So let's go ahead and get started.
Now looking at the log function we have here, we have log2(x). So let's start by just plugging in some values of x and getting some ordered pairs. Starting with x equals 1, if I plug that into my function, I get log2(1). And I know anytime I take the log of 1, no matter what the base is, I'm always going to get 0. So I have my first ordered pair at (1,0), which I can go ahead and plot on my graph. Then if I plug in x equals 2 to my function, I get log2(2), which since my base is the exact same as what I'm taking the log of, I know that my answer here is going to be 1, and I get my second ordered pair at (2,1).
Now let's pause here and take a closer look at these two points. I have (1,0) and (2,1). Now looking over to my exponential function here, I have f(x)=2x, which is the inverse function of this log function that we are trying to graph here. Now, looking at my exponential function, I have these two points, (0,1) and (1,2). And looking back to the points that we just found, I notice that these are the same exact points with x and y flipped. This is because these are inverse functions, so this is actually going to work for every single x and y value of our exponential function. If we simply flip them, we'll have all of the new ordered pairs needed to graph our log function. So let's go ahead and flip our x and y values and get these points plotted on our graph.
So looking at our first point here, (1/4, -2) having flipped those points, there's my new point. And then for (1/2, -1), I know f(x)=-1. Now flipping these final two points here, I'll end up with (4,2) and (8,3). And we can go ahead and plot all of these on our graph. So (4,2), (8,3), and then for our small fractions, (1/2, -1) and (1/4, -2). Now connecting all of these points, I have a complete graph of my log function.
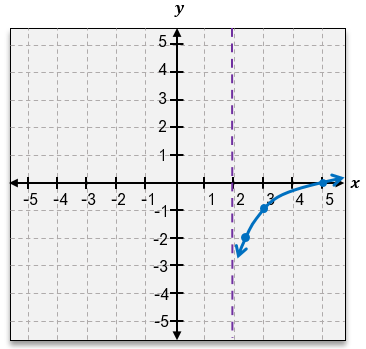
And I notice here on this side that we're getting really close to that y-axis but not quite touching it, which tells us that we're, of course, dealing with an asymptote that I can go ahead and plot using a dashed line right along that y-axis to form my vertical asymptote.
Now that we have the complete picture of the graph of our log function, let's compare it to our original exponential function. Now looking at the graph of my exponential function here, if I were to take my entire graph and fold it along this diagonal line and then stamp my exponential function onto the other side, I would end up with a graph identical to the log function that we just graphed because this is actually exactly what we did. We simply reflected the graph of our exponential function over this diagonal line, y equals x, in order to get the graph of our log function. Now this will work for any log function and its corresponding inverse exponential function because they're inverses. They're always going to be reflections of each other along the line y equals x.
Now if you want a way to remember the shapes of these graphs, remember when you're dealing with an exponential function, you can think of a lowercase e. And if we just extend the tail of that e out, it looks really similar to the shape of the graph of our exponential function. And for a logarithmic function, if we look at our word logarithmic and we take that lowercase r and extend that r out, we get a shape really similar to the graph of our logarithmic function. So remember, for an exponential function graph, the shape looks really similar to extending a lowercase e, whereas for a logarithmic function, we extend that lowercase r.
Now that we have a good idea of what's going on with the shapes of these graphs and what they look like, let's also consider their domain and range. When graphing our log function, we were able to flip the x and y values of the inverse exponential function, and we can actually do the same exact thing to our domain and range. So the domain of our exponential function corresponds to the range of our inverse log function, so it's going to be all real numbers for any log function of any base. Then also the range of our exponential function corresponds to the domain of our log function, and it's going to depend on our asymptote and, in this case, go from 0 to infinity.
Now speaking of asymptotes, we also can take a look at our asymptote here, and we had a horizontal asymptote at y equals 0 for our exponential function, which then corresponds to a vertical asymptote now at x equals 0 for our logarithmic function. Now let's consider one final thing here and consider when we have to graph logs of different bases. Everything that we've looked at so far has been kind of the opposite of working with an exponential function, but this thing is going to be the exact same and the direction of our graph is going to depend on the value of our base b just as it did for exponential functions and it's going to depend on it in the exact same way. So for values of b that are greater than 1, like 2 or 3 or 10 or whatever, our graph is going to be increasing. And for values of b between 0 and 1, like say 1/2, our graph is instead going to be decreasing. Now that we know everything that we need to about graphing practice.