2. Graphs of Equations
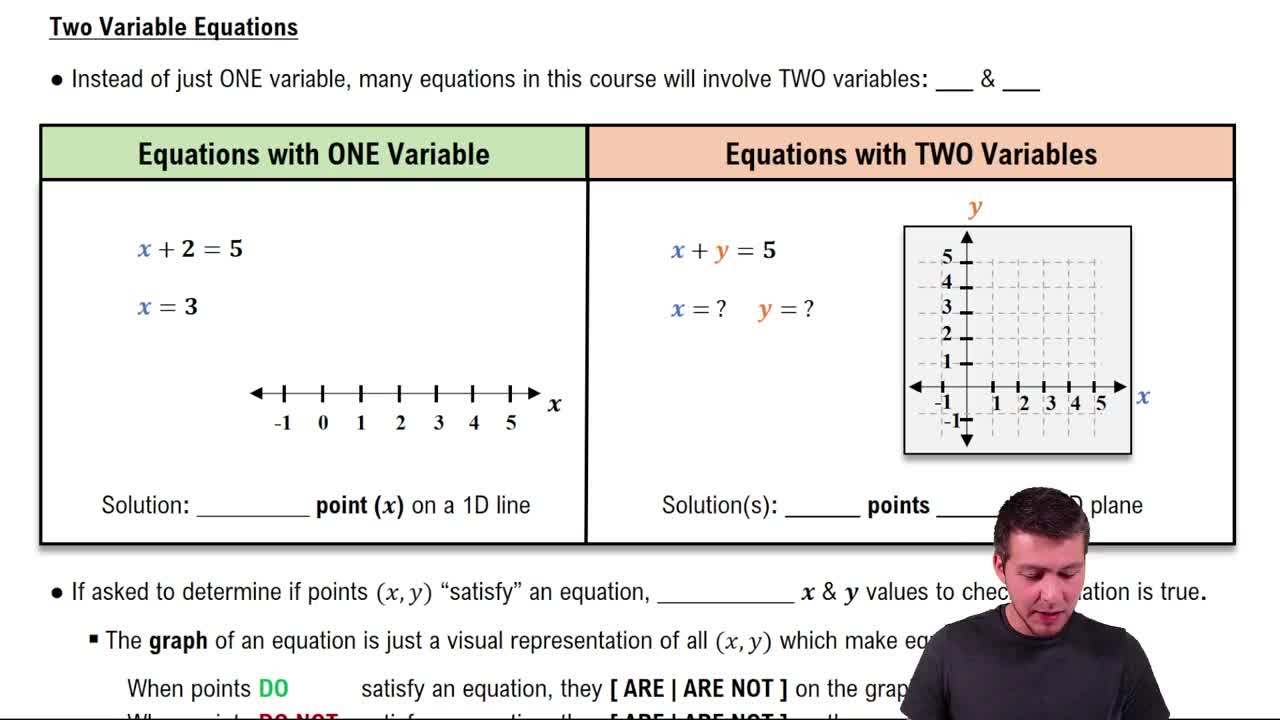
Two-Variable Equations
2. Graphs of Equations
Two-Variable Equations
 05:28
05:28
Additional 1 creators.
Learn with other creators


Practice this topic
- Multiple Choice
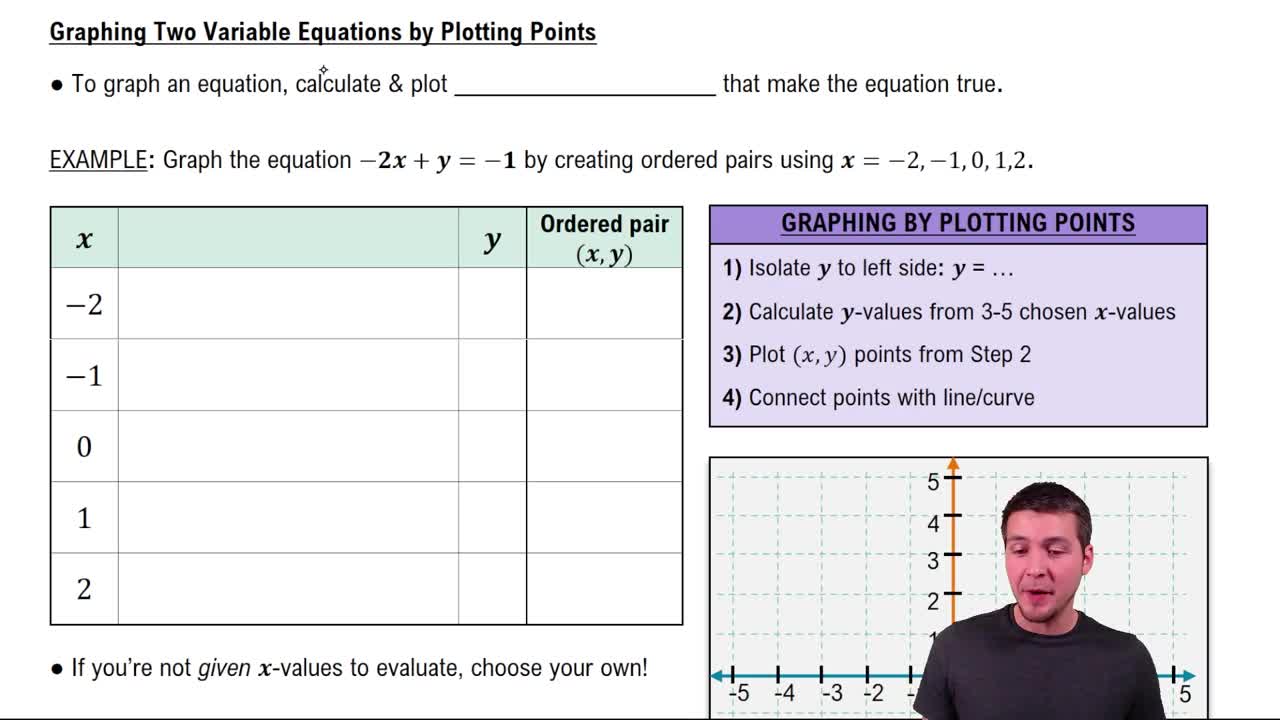
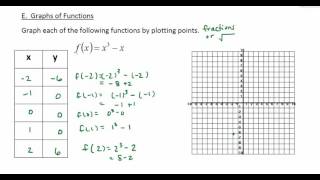
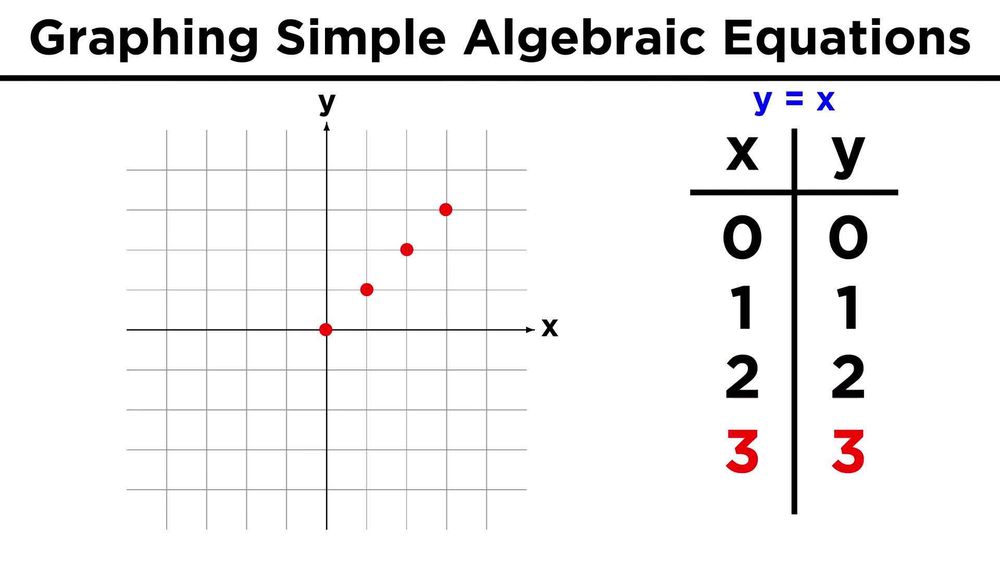
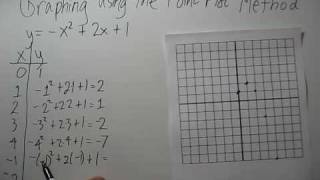
Graph the equation by choosing points that satisfy the equation.
1034views9rank - Multiple Choice
Graph the equation by choosing points that satisfy the equation. (Hint: Choose positive numbers only)
917views1rank - Textbook Question
Plot the given point in a rectangular coordinate system. (1, 4)
1161views - Textbook Question
Graph each equation in Exercises 1–4. Let x= -3, -2. -1, 0, 1, 2 and 3. y = 2x-2
956views - Textbook Question
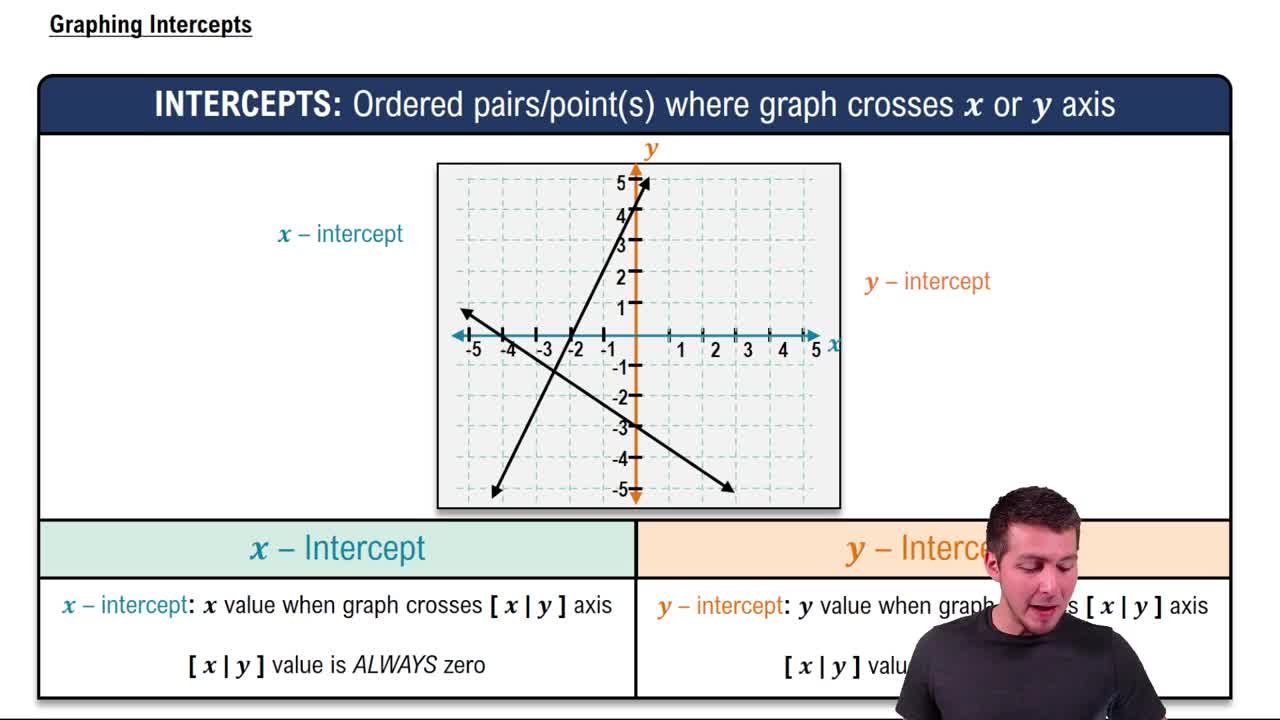
Fill in the blank to correctly complete each sentence. The x-intercept of the graph of 2x + 5y = 10 is ________.
794views - Textbook Question
Plot the given point in a rectangular coordinate system. (7/2, - 3/2)
833views