3. Functions
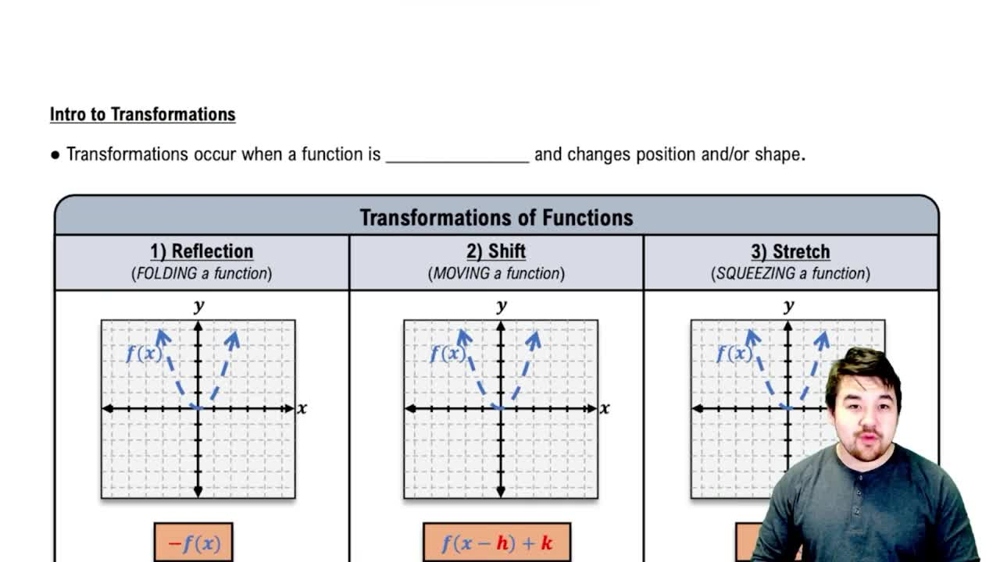
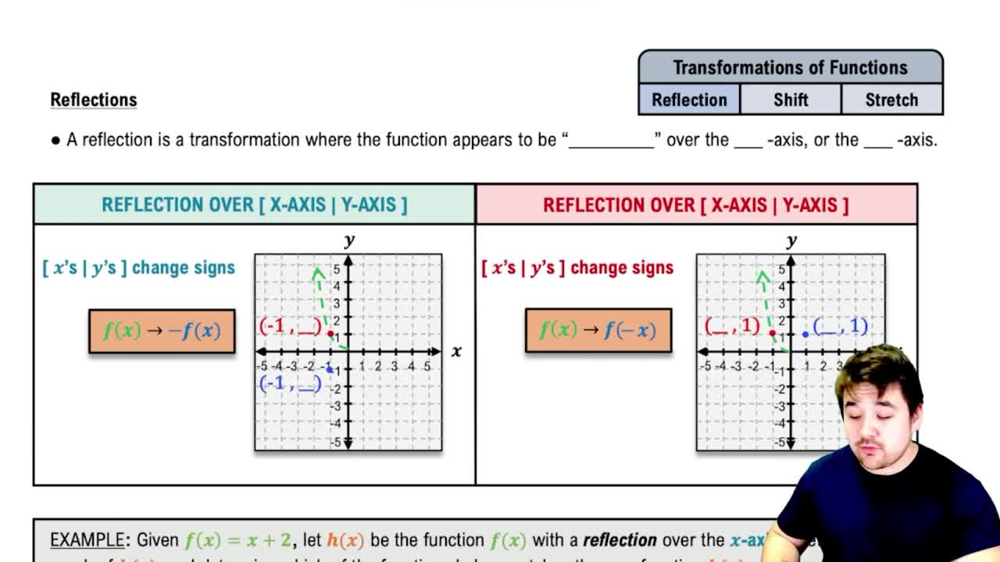
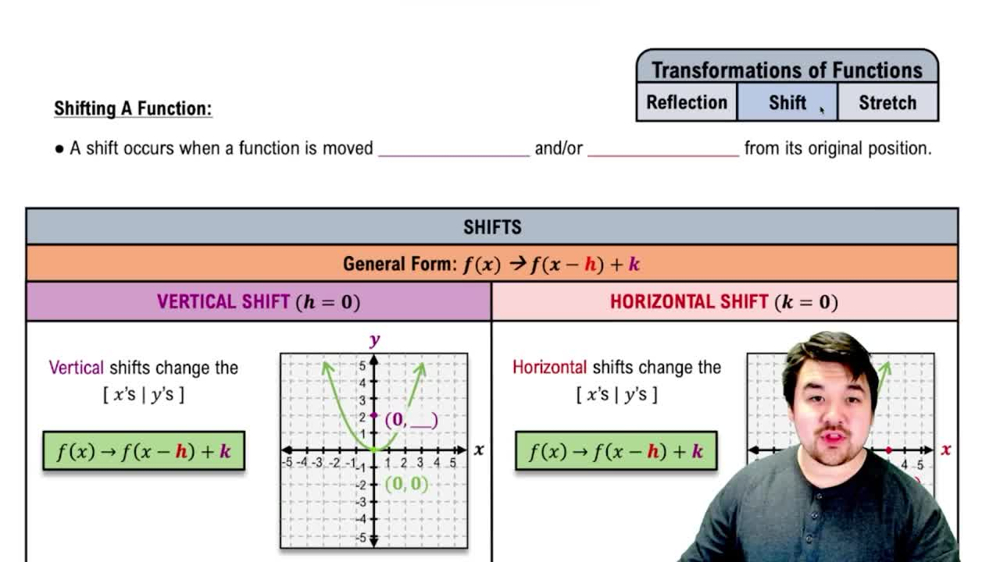
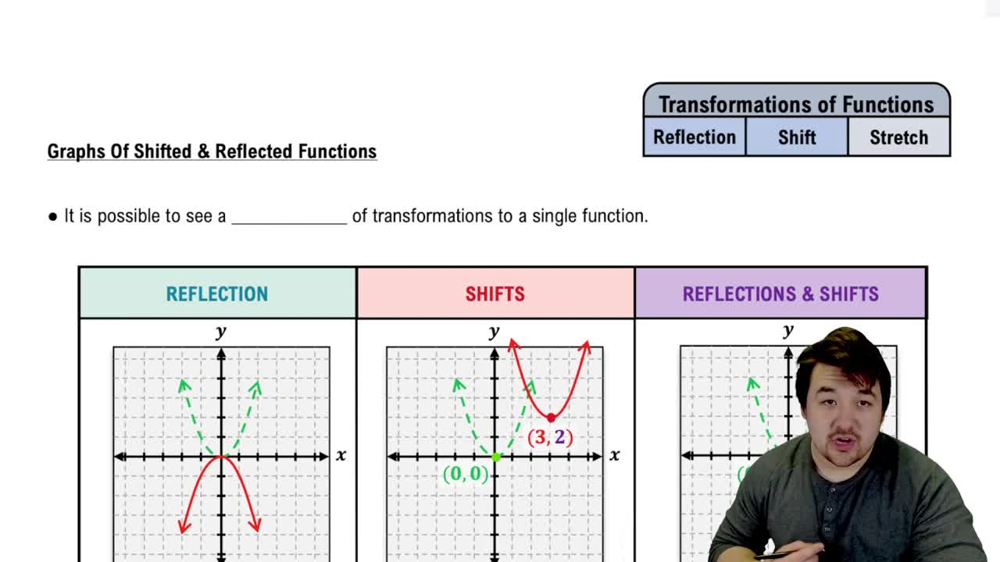
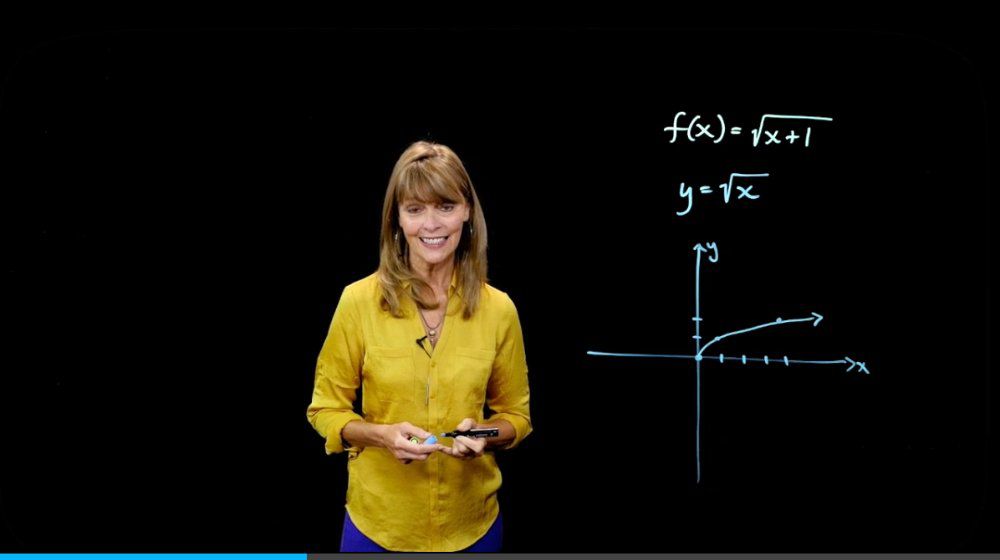
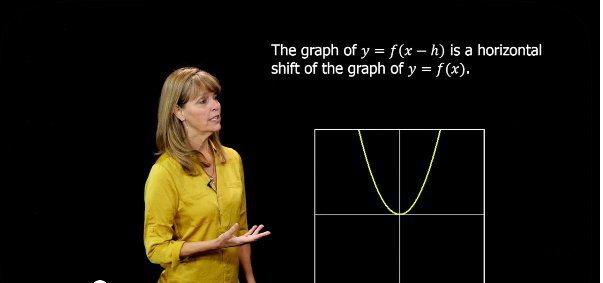
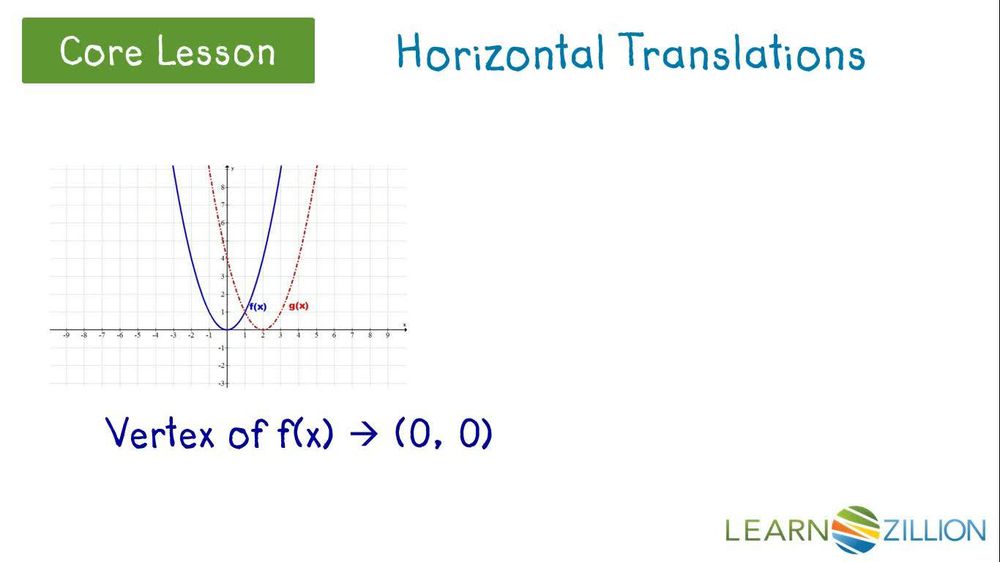
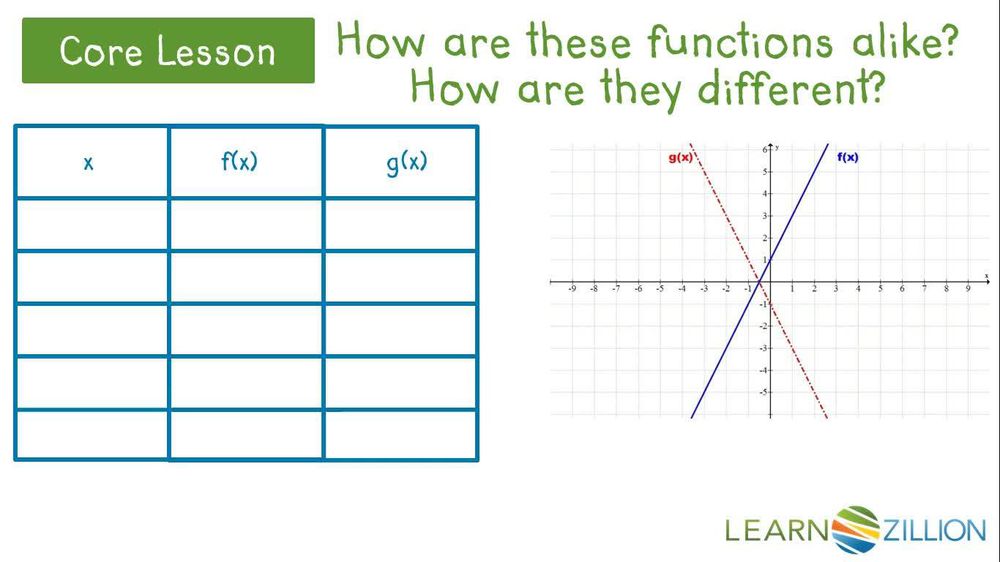
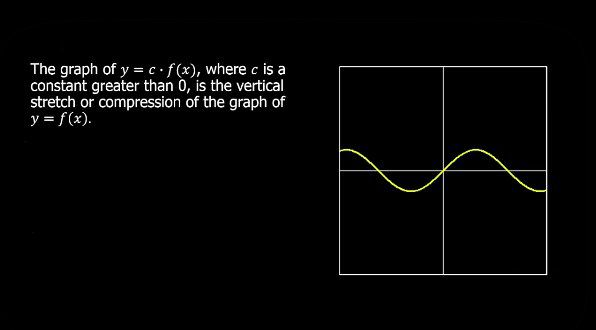
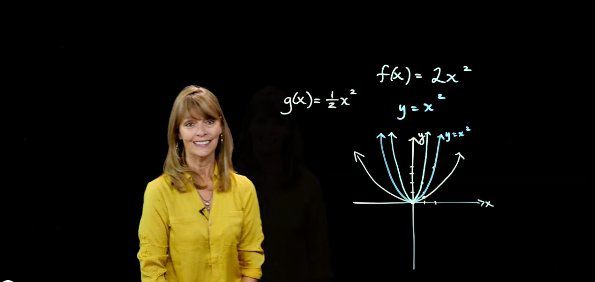
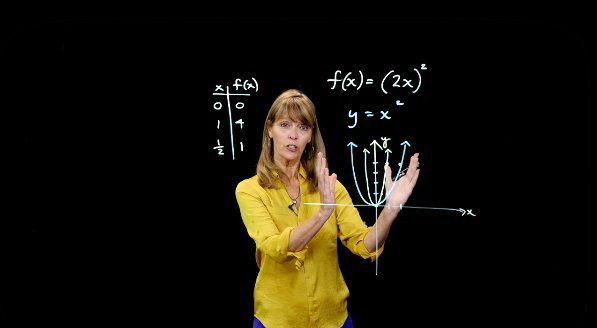
Transformations
 5:25
5:25
Learn with other creators


Practice this topic
- Multiple Choice
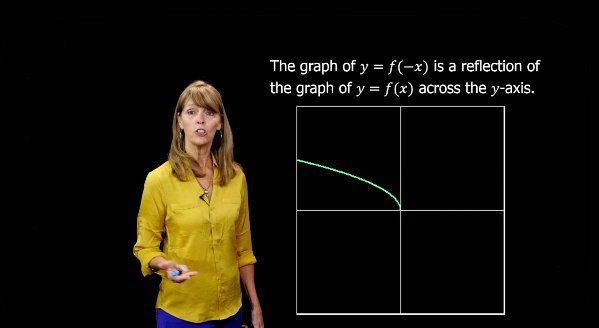
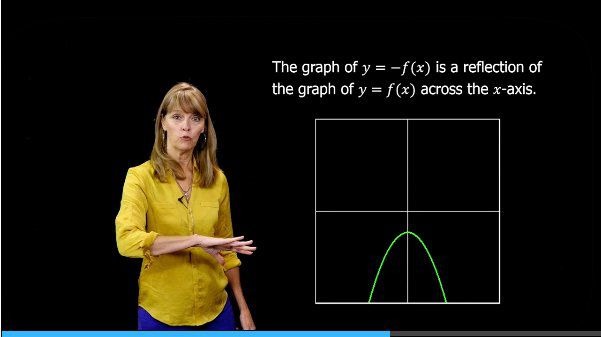
Written below (green dotted curve) is a graph of the function .If g(x) (blue solid curve) is a reflection of f(x) about the y-axis what is the equation for g(x)?
865views10rank - Multiple Choice
The green dotted line in the graph below represents the function . The blue solid line represents the function , which is the function after it has gone through a shift transformation. Find the equation for .
995views6rank - Multiple Choice
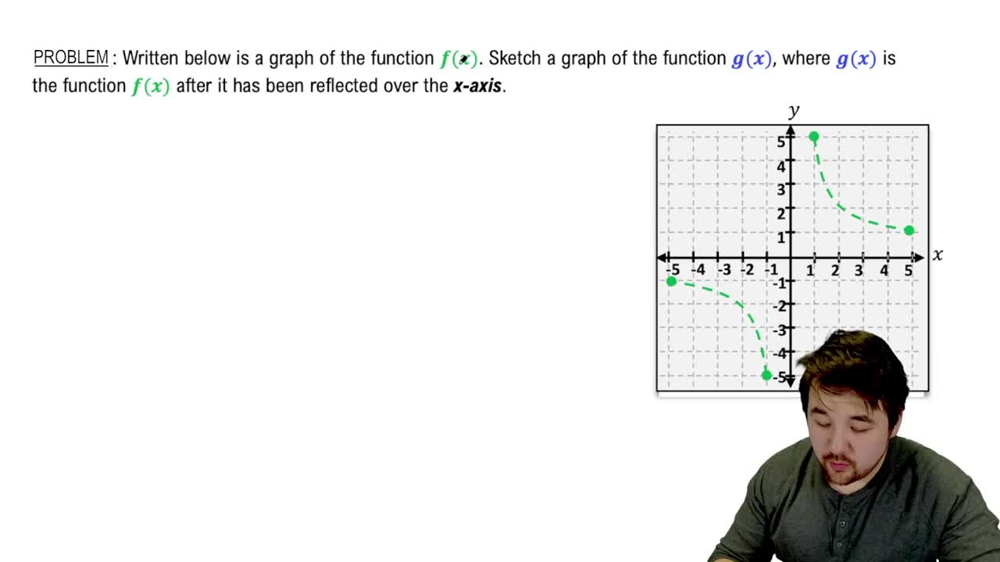
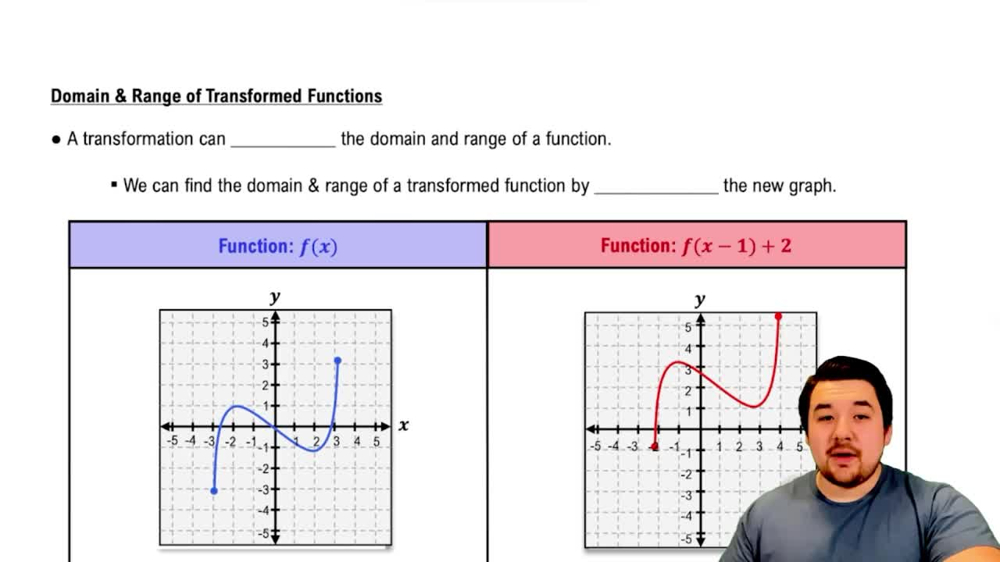
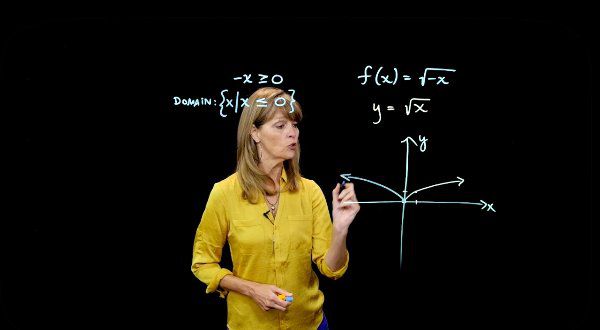
The green dotted curve below is a graph of the function . Find the domain and range of (the blue solid curve), which is a transformation of .
1332views10rank - Textbook Question
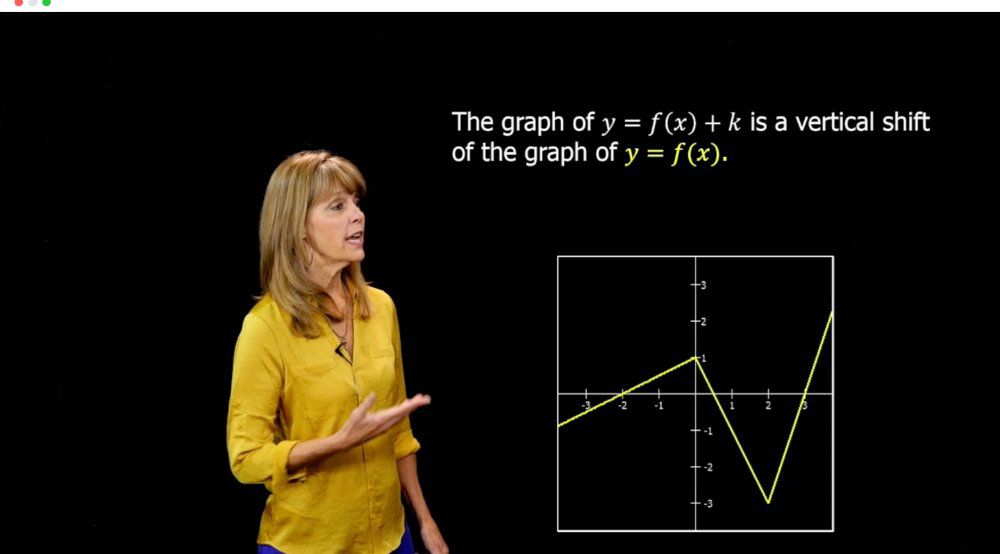
Use the graph of y = f(x) to graph each function g.
g(x) = f(x)+1
856views - Textbook Question
Use the graph of y = f(x) to graph each function g.
g(x) = f(x+1)
1176views - Textbook Question
Use the graph of y = f(x) to graph each function g.
g(x) = f(-x)
855views - Textbook Question
Use the graph of y = f(x) to graph each function g.
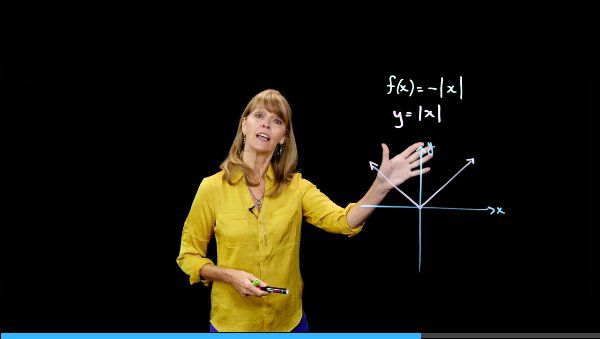
g(x) = -f(x) +3
753views - Multiple ChoiceIn the coordinate plane, triangle has vertices , , and . Triangle is a dilation of about the origin with vertices , , and . What is the scale factor from to ?34views