Ch. 2 - Graphs and Functions
Lial - College Algebra 13th Edition
Lial13th EditionCollege AlgebraISBN: 9780136881063Not the one you use?Change textbook
Chapter 3, Problem 29

Graph each piecewise-defined function.
f(x)={12x2+2if x212xif x>2f(x) =\(\begin{cases}\)-\(\frac{1}{2}\)x^2 + 2 & \(\text{if }\) x \(\leq\) 2 \(\frac{1}{2}\)x & \(\text{if }\) x > 2\(\end{cases}\)

Verified step by step guidance
1
Identify the two pieces of the piecewise function and their respective domains: \(f(x) = x^2 - 2\) for \(x \leq 1\) and \(f(x) = 2x\) for \(x > 1\).
Graph the first piece \(f(x) = x^2 - 2\) for all \(x\) values less than or equal to 1. This is a parabola shifted down by 2 units. Plot points including \(x=1\) to find the boundary value.
Graph the second piece \(f(x) = 2x\) for all \(x\) values greater than 1. This is a straight line with slope 2. Start plotting from just greater than \(x=1\) to the right.
At \(x=1\), evaluate both pieces to check if the function is continuous. Calculate \(f(1)\) from the first piece and the limit from the second piece as \(x\) approaches 1 from the right.
Use open or closed circles to indicate whether the point at \(x=1\) is included in the graph for each piece: closed circle for \(x \leq 1\) and open circle for \(x > 1\). Then connect the points smoothly according to the function definitions.

Verified video answer for a similar problem:

This video solution was recommended by our tutors as helpful for the problem above.
Video duration:
5m
Was this helpful?

Key Concepts

Here are the essential concepts you must grasp in order to answer the question correctly.

Piecewise-Defined Functions

A piecewise-defined function is a function composed of different expressions depending on the input value's domain. Each piece applies to a specific interval, and the function's overall graph combines these pieces. Understanding how to interpret and graph each piece separately is essential.
Recommended video:
3:51
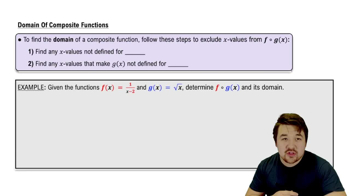
Domain Restrictions of Composed Functions

Graphing Quadratic and Linear Functions

The function includes a quadratic expression (x² - 2) for x ≤ 1 and a linear expression (2x) for x > 1. Knowing how to graph quadratic functions (parabolas) and linear functions (straight lines) helps in plotting each piece accurately on the coordinate plane.
Recommended video:
5:26
Graphs of Logarithmic Functions

Domain Restrictions and Continuity

Each piece of the function is defined over a specific domain (x ≤ 1 or x > 1). Understanding domain restrictions ensures correct graphing boundaries. Additionally, checking the function's value at the boundary (x = 1) helps determine if the graph is continuous or has a jump.
Recommended video:
3:51
Domain Restrictions of Composed Functions