Ch. 2 - Graphs and Functions
Lial - College Algebra 13th Edition
Lial13th EditionCollege AlgebraISBN: 9780136881063Not the one you use?Change textbook
Chapter 3, Problem 3

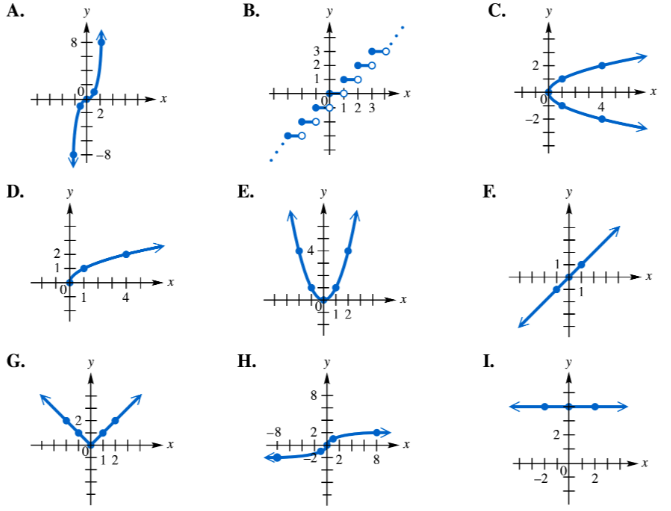
To answer each question, refer to the following basic graphs. Which one is the graph of ƒ(x)=x3? What is its range?
Nine labeled graphs show different functions, asking which represents f(x) = x³ and what its range is.

Verified step by step guidance
1
Recall the basic shape of the graph of the function \(f(x) = x^{3}\). It is a cubic function, which typically has an S-shaped curve passing through the origin (0,0).
Identify the key characteristics of the cubic graph: it is symmetric about the origin (odd function), increases without bound as \(x\) goes to positive infinity, and decreases without bound as \(x\) goes to negative infinity.
Look at the given graphs and find the one that matches this description: an S-shaped curve passing through the origin, with the left side going down and the right side going up.
Once the correct graph is identified, determine the range of \(f(x) = x^{3}\). Since cubic functions can produce all real numbers as outputs, the range is all real numbers.
Express the range in interval notation as \((-\infty, \infty)\), indicating that the function's output values cover every real number.

Verified video answer for a similar problem:

This video solution was recommended by our tutors as helpful for the problem above.
Video duration:
3m
Was this helpful?

Key Concepts

Here are the essential concepts you must grasp in order to answer the question correctly.

Cubic Function and Its Graph

A cubic function is a polynomial of degree three, typically written as f(x) = x³. Its graph is a smooth curve that passes through the origin, increasing from negative infinity to positive infinity, with an inflection point at (0,0). Recognizing this shape helps identify the correct graph among options.
Recommended video:
5:26
Graphs of Logarithmic Functions

Range of a Function

The range of a function is the set of all possible output values (f(x)) it can produce. For f(x) = x³, since x can be any real number and cubing preserves sign and magnitude, the range is all real numbers, meaning the graph extends infinitely in both vertical directions.
Recommended video:
4:22
Domain & Range of Transformed Functions

Interpreting Basic Graphs

Understanding how to read and interpret basic function graphs is essential. This includes identifying key features like intercepts, end behavior, and shape. For f(x) = x³, the graph’s characteristic S-shape and continuous increase help distinguish it from other polynomial graphs.
Recommended video:
Guided course
05:10
Graphs & the Rectangular Coordinate System