Ch. 4 - Inverse, Exponential, and Logarithmic Functions
Lial - College Algebra 13th Edition
Lial13th EditionCollege AlgebraISBN: 9780136881063Not the one you use?Change textbook
Chapter 5, Problem 27

Graph each function. ƒ(x) = 3x

Verified step by step guidance
1
Identify the type of function given. Here, the function is an exponential function of the form \(f(x) = 3^x\), where the base is 3 and the exponent is the variable \(x\).
Determine key points to plot by substituting values of \(x\) into the function. For example, calculate \(f(-1) = 3^{-1}\), \(f(0) = 3^0\), \(f(1) = 3^1\), and \(f(2) = 3^2\). These points will help you understand the shape of the graph.
Plot the points found on the coordinate plane. Remember that \$3^0 = 1\(, so the graph will pass through the point \)(0,1)$, which is a key characteristic of exponential functions.
Analyze the behavior of the graph as \(x\) approaches positive and negative infinity. For \(f(x) = 3^x\), as \(x \to \infty\), \(f(x) \to \infty\), and as \(x \to -\infty\), \(f(x) \to 0\). This means the graph will rise steeply to the right and approach the x-axis but never touch it on the left.
Draw a smooth curve through the plotted points, ensuring the graph reflects the exponential growth and the horizontal asymptote at \(y=0\). Label the axes and the function for clarity.

Verified video answer for a similar problem:

This video solution was recommended by our tutors as helpful for the problem above.
Video duration:
5m
Was this helpful?

Key Concepts

Here are the essential concepts you must grasp in order to answer the question correctly.

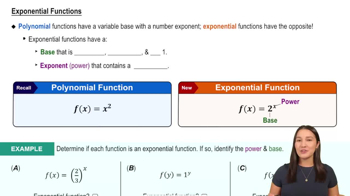
Exponential Functions

An exponential function has the form f(x) = a^x, where the base a is a positive constant not equal to 1. The function grows or decays rapidly depending on whether a is greater than or less than 1. Understanding this form helps in predicting the shape and behavior of the graph.
Recommended video:
6:13
Exponential Functions

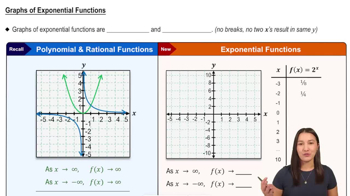
Graphing Exponential Functions

To graph an exponential function like f(x) = 3^x, plot key points such as when x = 0 (f(0) = 1) and other integer values. The graph passes through (0,1) and increases rapidly for positive x, approaching zero but never touching the x-axis for negative x. Recognizing these features aids in sketching the curve accurately.
Recommended video:
5:46
Graphs of Exponential Functions

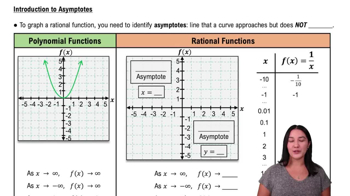
Asymptotes

An asymptote is a line that the graph approaches but never touches. For f(x) = 3^x, the x-axis (y=0) is a horizontal asymptote, meaning the function values get closer to zero as x becomes very negative. Identifying asymptotes helps understand the long-term behavior of the function.
Recommended video:
6:24
Introduction to Asymptotes