Ch. 4 - Inverse, Exponential, and Logarithmic Functions
Lial - College Algebra 13th Edition
Lial13th EditionCollege AlgebraISBN: 9780136881063Not the one you use?Change textbook
Chapter 5, Problem 77

Graph the inverse of each one-to-one function.
Graph showing a one-to-one function and its inverse reflected across the line y = x.

Verified step by step guidance
1
Identify the given function on the graph. Here, the red curve represents the function, which appears to be an exponential function increasing from left to right.
Recall that the inverse of a function swaps the roles of the x- and y-coordinates. This means the inverse function reflects the original function across the line \(y = x\).
To graph the inverse, take several points on the original function, such as \((x, y)\), and plot their inverses as \((y, x)\). For example, if the function passes through \((1, 2)\), the inverse will pass through \((2, 1)\).
Draw the line \(y = x\) as a reference. This line acts as a mirror for the function and its inverse.
Using the reflected points, sketch the inverse function. For an exponential function, the inverse will typically be a logarithmic curve, increasing slowly and passing through points reflected over the line \(y = x\).

Verified video answer for a similar problem:

This video solution was recommended by our tutors as helpful for the problem above.
Video duration:
1m
Was this helpful?

Key Concepts

Here are the essential concepts you must grasp in order to answer the question correctly.

One-to-One Function

A one-to-one function is a function where each output value corresponds to exactly one input value. This property ensures the function has an inverse because no two different inputs produce the same output, allowing the inverse to be well-defined.
Recommended video:
4:07
Decomposition of Functions

Inverse Function

The inverse of a function reverses the roles of inputs and outputs, meaning if the original function maps x to y, the inverse maps y back to x. Graphically, the inverse is a reflection of the original function across the line y = x.
Recommended video:
4:30
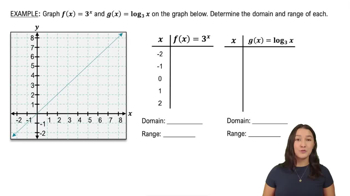
Graphing Logarithmic Functions

Graphing and Reflection Across y = x

To graph the inverse of a function, reflect each point of the original function across the line y = x. This means swapping the x- and y-coordinates of each point, which visually demonstrates the inverse relationship between the function and its inverse.
Recommended video:
4:25
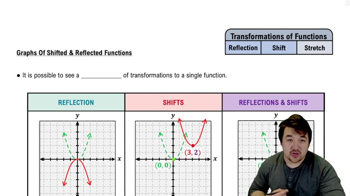
Graphs of Shifted & Reflected Functions