Ch. 2 - Graphs and Functions
Lial - College Algebra 13th Edition
Lial13th EditionCollege AlgebraISBN: 9780136881063Not the one you use?Change textbook
Chapter 3, Problem 33b

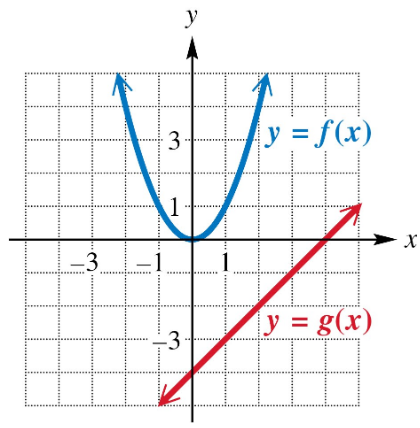
Use the graph to evaluate each expression. See Example 3(a).
(ƒ-g)(1)
Graph showing two functions: a blue parabola y = f(x) and a red line y = g(x) on coordinate axes.

Verified step by step guidance
1
Identify the value of x for which you need to evaluate the expression (f - g)(1). Here, x = 1.
Find the value of f(1) by locating x = 1 on the horizontal axis and then moving vertically to the orange curve representing f(x). Read the corresponding y-value.
Find the value of g(1) by locating x = 1 on the horizontal axis and then moving vertically to the blue line representing g(x). Read the corresponding y-value.
Use the definition of the difference of functions: (f - g)(1) = f(1) - g(1).
Subtract the value of g(1) from f(1) to get the result of (f - g)(1).

Verified video answer for a similar problem:

This video solution was recommended by our tutors as helpful for the problem above.
Video duration:
3m
Was this helpful?

Key Concepts

Here are the essential concepts you must grasp in order to answer the question correctly.

Function Evaluation

Function evaluation involves finding the output value of a function for a given input. For example, to evaluate f(1), locate x = 1 on the graph and find the corresponding y-value on the curve of f(x). This process is essential for understanding how functions behave at specific points.
Recommended video:
4:26
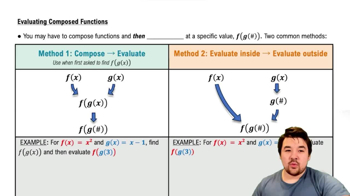
Evaluating Composed Functions

Function Operations (Subtraction)

Function operations combine two functions to create a new function. In subtraction, (f - g)(x) means subtracting the value of g(x) from f(x) for the same input x. Evaluating (f - g)(1) requires finding f(1) and g(1) separately, then subtracting g(1) from f(1).
Recommended video:
5:56
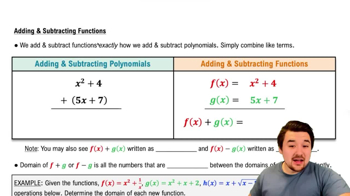
Adding & Subtracting Functions

Interpreting Graphs of Functions

Interpreting graphs involves reading values from the plotted curves of functions. By identifying points on the graph at a specific x-value, you can determine the corresponding y-values for f(x) and g(x). This skill is crucial for evaluating expressions like (f - g)(1) using graphical data.
Recommended video:
5:26
Graphs of Logarithmic Functions