Ch. 1 - Equations and Inequalities
Blitzer - College Algebra 8th Edition
Blitzer8th EditionCollege AlgebraISBN: 9780136970514Not the one you use?Change textbook
Chapter 2, Problem 1

In Exercises 1–14, express each interval in set-builder notation and graph the interval on a number line. (1, 6]

Verified step by step guidance
1
Identify the interval type: (1, 6] means the interval includes all numbers greater than 1 but less than or equal to 6.
Write the inequality that represents this interval: \(1 < x \leq 6\).
Express the interval in set-builder notation using the inequality: \(\{ x \mid 1 < x \leq 6 \}\).
To graph the interval on a number line, draw a number line and mark the points 1 and 6.
Use an open circle at 1 to show that 1 is not included, and a closed circle at 6 to show that 6 is included; then shade the region between 1 and 6.

Verified video answer for a similar problem:

This video solution was recommended by our tutors as helpful for the problem above.
Video duration:
1m
Was this helpful?

Key Concepts

Here are the essential concepts you must grasp in order to answer the question correctly.

Interval Notation

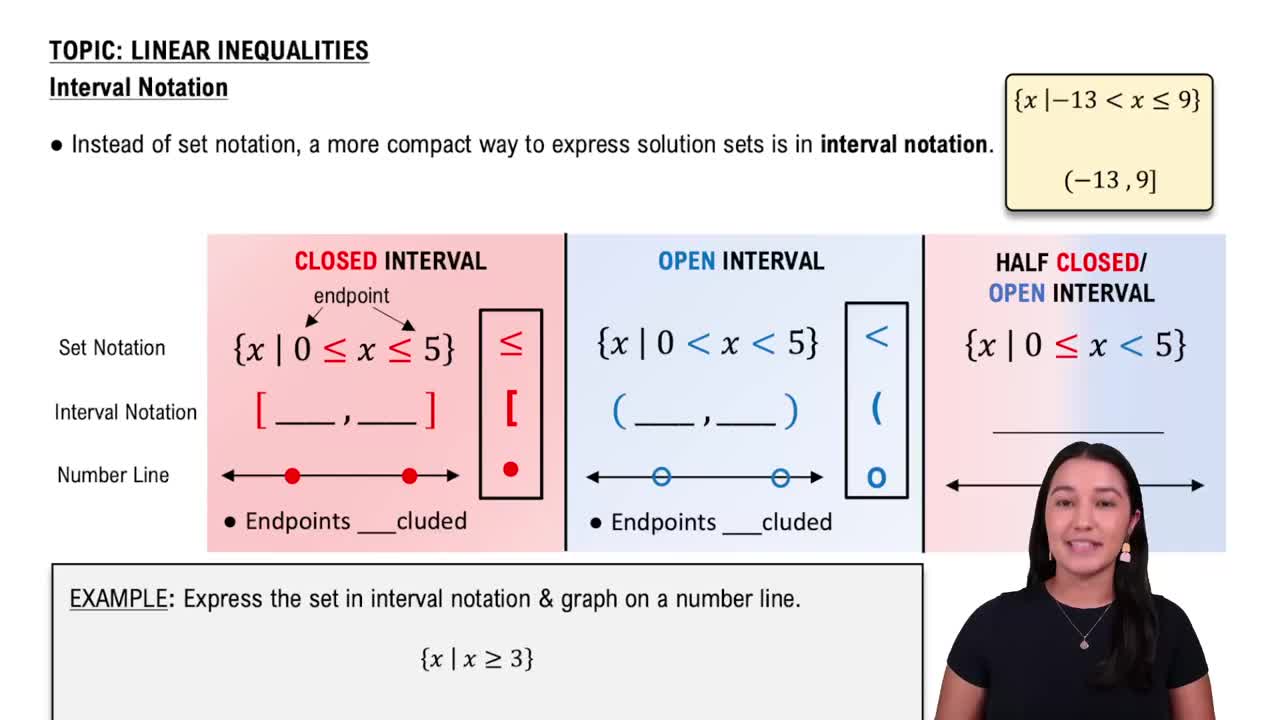
Interval notation is a way to represent a set of numbers between two endpoints. Parentheses () indicate that an endpoint is not included (open), while brackets [] mean the endpoint is included (closed). For example, (1, 6] includes all numbers greater than 1 and up to and including 6.
Recommended video:
05:18
Interval Notation

Set-Builder Notation

Set-builder notation describes a set by specifying a property that its members satisfy. It typically uses a variable and a condition, such as {x | 1 < x ≤ 6}, meaning the set of all x such that x is greater than 1 and less than or equal to 6.
Recommended video:
05:18
Interval Notation

Graphing Intervals on a Number Line

Graphing intervals involves marking the endpoints on a number line and indicating whether they are included or excluded. Use an open circle for excluded endpoints and a closed circle for included endpoints, then shade the region between to represent all numbers in the interval.
Recommended video:
Guided course
02:35
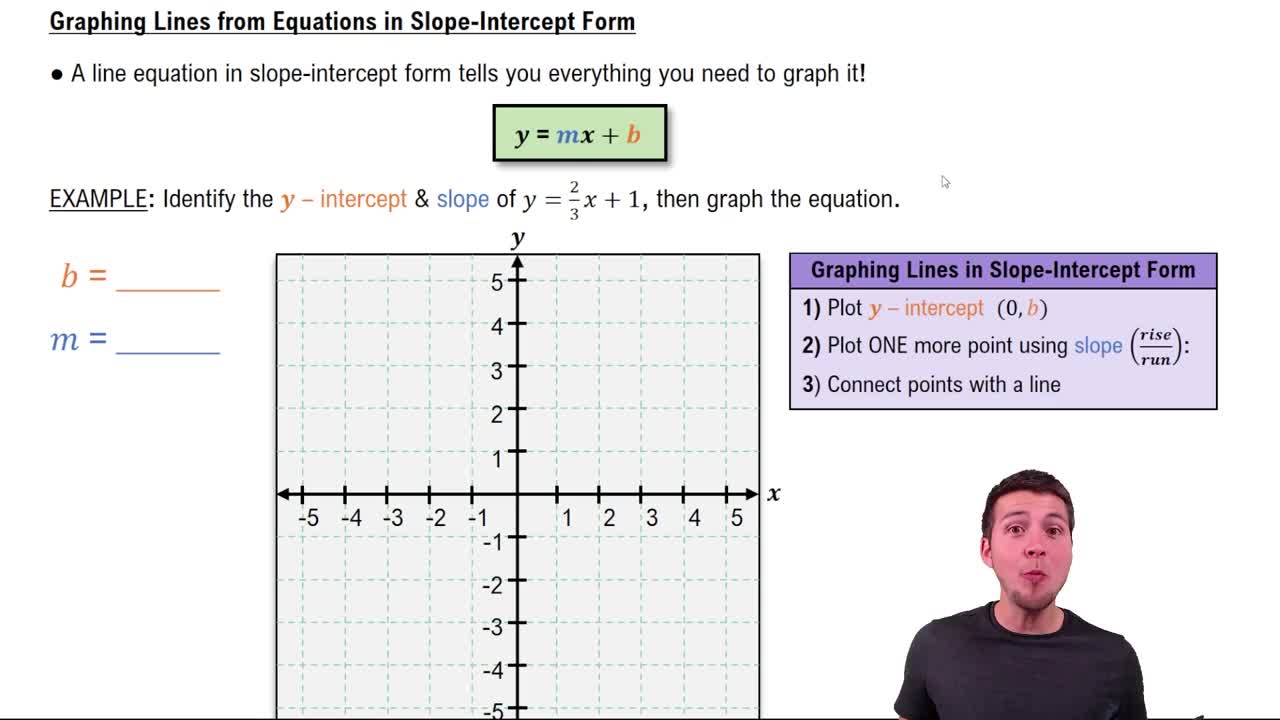
Graphing Lines in Slope-Intercept Form