Ch. 2 - Graphs and Functions
Lial - College Algebra 13th Edition
Lial13th EditionCollege AlgebraISBN: 9780136881063Not the one you use?Change textbook
Chapter 3, Problem 44

Graph each equation.
ƒ(x)=3ƒ(x) = 3

Verified step by step guidance
1
Identify the type of function given. The function ƒ(x) = 3 is a constant function, meaning it outputs the same value regardless of the input x.
Understand that the graph of a constant function is a horizontal line because the output value does not change as x changes.
Write the equation of the horizontal line, which is simply y = 3, since ƒ(x) = 3 means the output y is always 3.
To graph the function, plot several points where the y-coordinate is 3 for different values of x, such as (0, 3), (1, 3), (-1, 3), etc.
Draw a straight horizontal line through all these points, extending infinitely in both directions along the x-axis.

Verified video answer for a similar problem:

This video solution was recommended by our tutors as helpful for the problem above.
Video duration:
53s
Was this helpful?

Key Concepts

Here are the essential concepts you must grasp in order to answer the question correctly.

Constant Functions

A constant function is a function where the output value is the same for every input. In this case, ƒ(x) = 3 means the function always outputs 3 regardless of x. Its graph is a horizontal line crossing the y-axis at 3.
Recommended video:
6:13
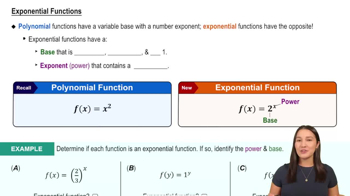
Exponential Functions

Graphing Horizontal Lines

Horizontal lines on the coordinate plane have the form y = c, where c is a constant. They run parallel to the x-axis and indicate that the y-value does not change as x varies. For ƒ(x) = 3, the line is horizontal at y = 3.
Recommended video:
Guided course
02:35
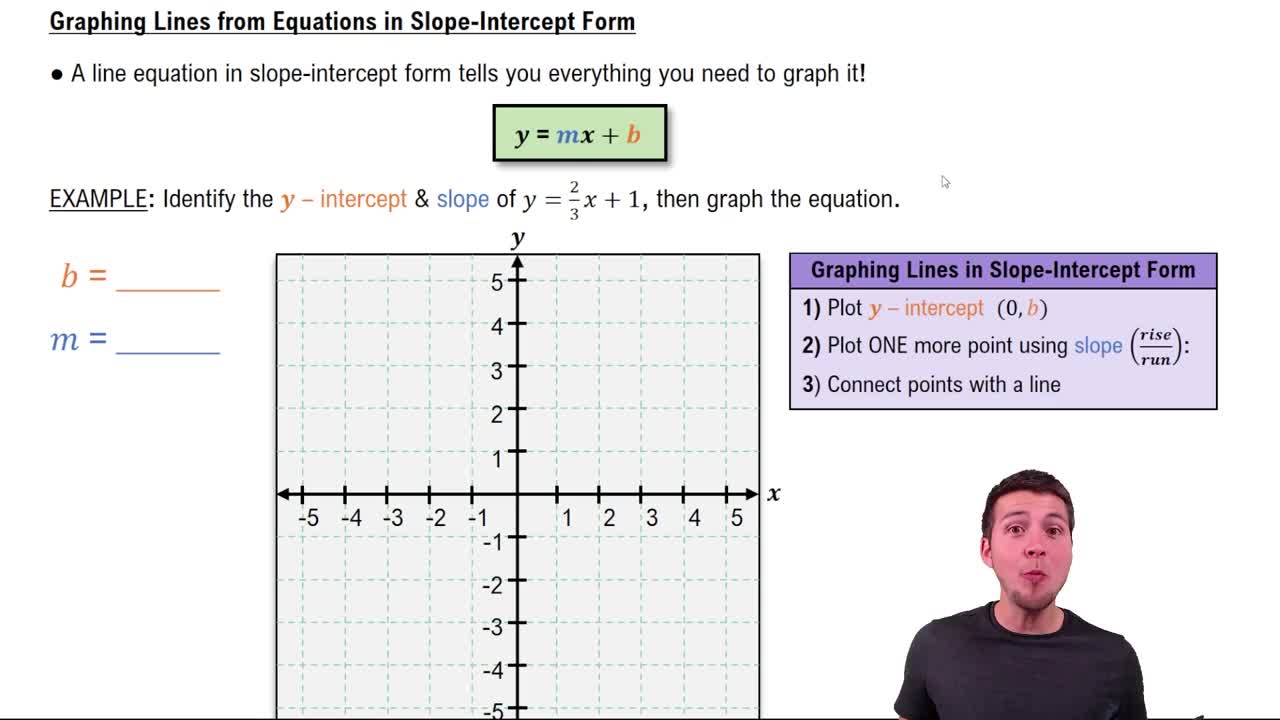
Graphing Lines in Slope-Intercept Form

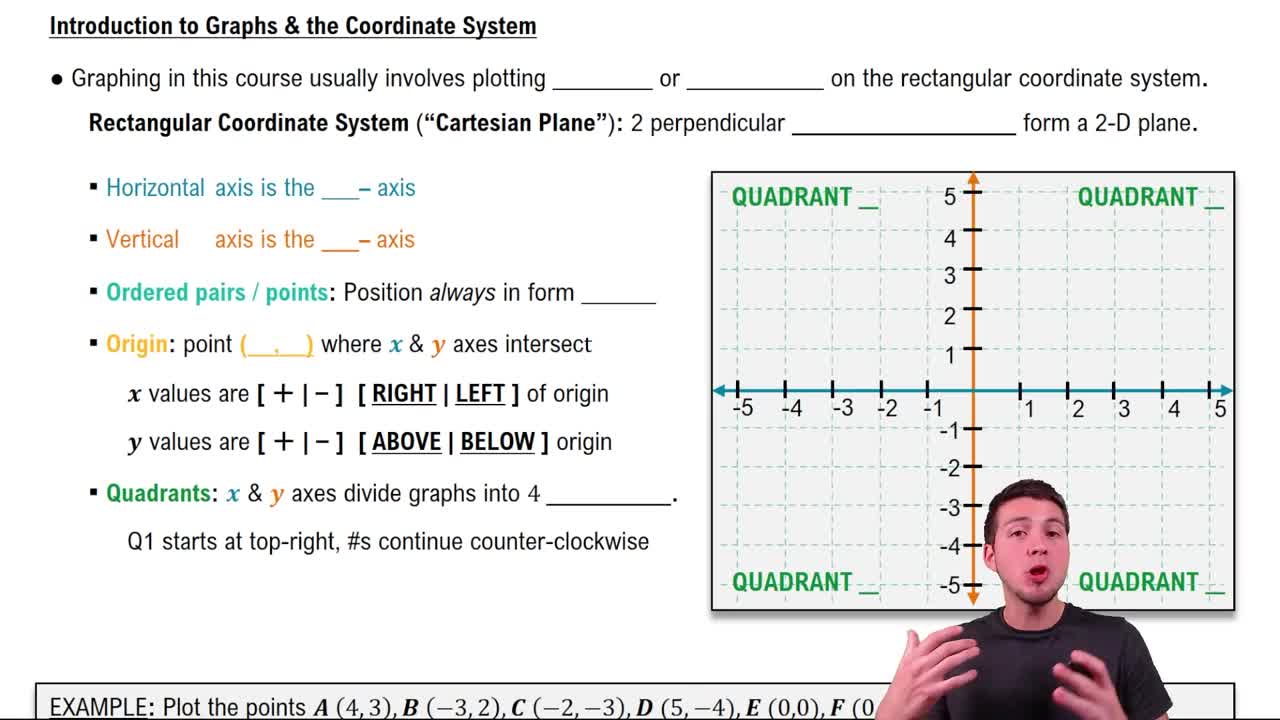
Coordinate Plane and Plotting Points

The coordinate plane consists of an x-axis and y-axis used to plot points (x, y). To graph ƒ(x) = 3, plot multiple points where y is always 3, such as (0,3), (1,3), and (-2,3), then connect them to form the horizontal line.
Recommended video:
Guided course
05:10
Graphs & the Rectangular Coordinate System