Ch. 2 - Graphs and Functions
Lial - College Algebra 13th Edition
Lial13th EditionCollege AlgebraISBN: 9780136881063Not the one you use?Change textbook
Chapter 3, Problem 70

Graph each function.
ƒ(x)=xƒ(x) = -|x|

Verified step by step guidance
1
Understand the parent function: The function ƒ(x) = |x| represents the absolute value of x, which forms a V-shaped graph opening upwards with its vertex at the origin (0,0).
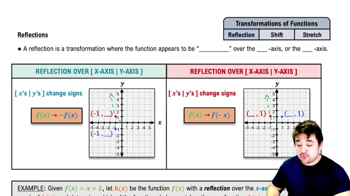
Identify the transformation: The given function is ƒ(x) = -|x|, which means the absolute value function is multiplied by -1. This reflects the graph of |x| across the x-axis.
Determine the vertex: Since there are no horizontal or vertical shifts, the vertex remains at the origin (0,0).
Plot key points: Choose values of x such as -2, -1, 0, 1, and 2. Calculate ƒ(x) = -|x| for each to get points like (-2, -2), (-1, -1), (0, 0), (1, -1), and (2, -2).
Draw the graph: Connect the plotted points with straight lines forming an upside-down V shape, opening downward, with the vertex at the origin.

Verified video answer for a similar problem:

This video solution was recommended by our tutors as helpful for the problem above.
Video duration:
2m
Was this helpful?

Key Concepts

Here are the essential concepts you must grasp in order to answer the question correctly.

Absolute Value Function

The absolute value function, denoted |x|, outputs the distance of x from zero on the number line, always yielding a non-negative result. Its graph is a V-shaped curve with the vertex at the origin (0,0), opening upwards.
Recommended video:
4:56
Function Composition

Reflection Across the x-axis

Multiplying a function by -1 reflects its graph across the x-axis. For ƒ(x) = -|x|, the standard V-shape of |x| is flipped upside down, creating an inverted V that opens downward.
Recommended video:
5:00
Reflections of Functions

Graphing Piecewise Functions

The absolute value function can be expressed as a piecewise function: |x| = x if x ≥ 0, and -x if x < 0. Understanding this helps in plotting points accurately and visualizing how the negative sign affects each piece.
Recommended video:
5:26
Graphs of Logarithmic Functions