Textbook QuestionIn Exercises 1-16, use the graph of y = f(x) to graph each function g. g(x) = f(x)+1269views
Textbook QuestionIn Exercises 1-16, use the graph of y = f(x) to graph each function g. g(x) = f(x+1)516views
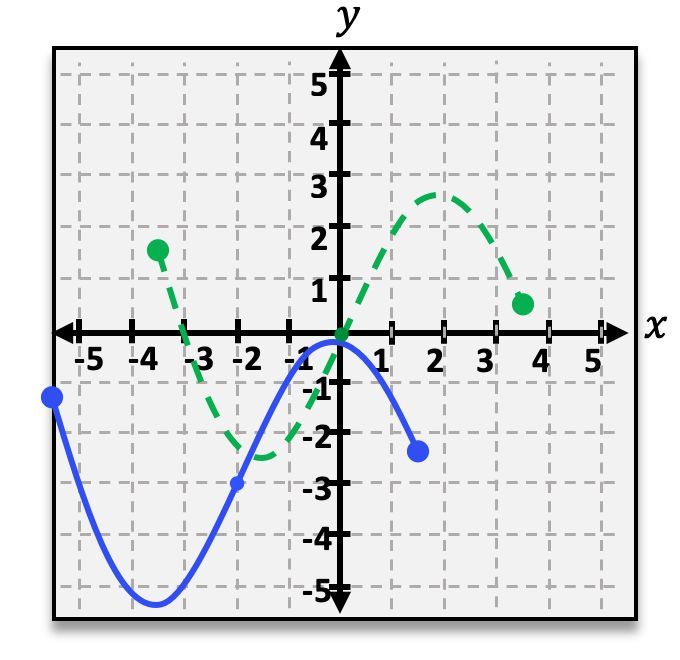
Textbook QuestionIn Exercises 1-16, use the graph of y = f(x) to graph each function g. g(x) = f(-x)234views
Textbook QuestionIn Exercises 1-16, use the graph of y = f(x) to graph each function g. g(x) = -f(x) +3226views
Textbook QuestionIn Exercises 1-16, use the graph of y = f(x) to graph each function g. g(x) = f(-x)+3364views
Textbook QuestionIn Exercises 1-16, use the graph of y = f(x) to graph each function g. g(x) = 2f(x)273views
Textbook QuestionIn Exercises 1-16, use the graph of y = f(x) to graph each function g. g(x) = f(x/2)227views
Textbook QuestionIn Exercises 1-16, use the graph of y = f(x) to graph each function g. g(x) = -f(2x) - 1249views
Textbook QuestionIn Exercises 17-32, use the graph of y = f(x) to graph each function g. g(x) = f(x) - 1253views
Textbook QuestionIn Exercises 17-32, use the graph of y = f(x) to graph each function g. g(x) = f(x-1)231views
Textbook QuestionIn Exercises 17-32, use the graph of y = f(x) to graph each function g. g(x) = f(x-1)+2341views
Textbook QuestionIn Exercises 17-32, use the graph of y = f(x) to graph each function g. g(x) = f(x + 1) − 2200views
Textbook QuestionIn Exercises 17-32, use the graph of y = f(x) to graph each function g. g(x) = f(-x)236views
Textbook QuestionIn Exercises 17-32, use the graph of y = f(x) to graph each function g. g(x) = f(-x)+1273views
Textbook QuestionIn Exercises 17-32, use the graph of y = f(x) to graph each function g. g(x) = -f(x)+1205views
Textbook QuestionIn Exercises 17-32, use the graph of y = f(x) to graph each function g. g(x) = ½ f(x)210views
Textbook QuestionIn Exercises 33-44, use the graph of y = f(x) to graph each function g. g(x) = f(x)+2274views
Textbook QuestionIn Exercises 33-44, use the graph of y = f(x) to graph each function g. g(x) = f(x+2)207views
Textbook QuestionPlot each point, and then plot the points that are symmetric to the given point with respect to the (a) x-axis, (b) y-axis, and (c) origin. (5, -3)264views
Textbook QuestionIn Exercises 33-44, use the graph of y = f(x) to graph each function g. g(x) = -(1/2)f(x+2)210views
Textbook QuestionPlot each point, and then plot the points that are symmetric to the given point with respect to the (a) x-axis, (b) y-axis, and (c) origin. (-4, -2)206views
Textbook QuestionIn Exercises 33-44, use the graph of y = f(x) to graph each function g. g(x) = -½ ƒ ( x + 2) —2220views
Textbook QuestionIn Exercises 33-44, use the graph of y = f(x) to graph each function g. g(x) = (1/2)f(2x)243views
Textbook QuestionWithout graphing, determine whether each equation has a graph that is symmetric with respect to the x-axis, the y-axis, the origin, or none of these. See Examples 3 and 4. y=x^2+51073views
Textbook QuestionIn Exercises 45-52, use the graph of y = f(x) to graph each function g. g(x) = -f(x-1) + 1256views
Textbook QuestionWithout graphing, determine whether each equation has a graph that is symmetric with respect to the x-axis, the y-axis, the origin, or none of these. See Examples 3 and 4. x^2+y^2=12427views
Textbook QuestionIn Exercises 45-52, use the graph of y = f(x) to graph each function g. g(x) = -f(x + 1) − 1250views
Textbook QuestionIn Exercises 45-52, use the graph of y = f(x) to graph each function g. g(x)=2f(x-1)313views
Textbook QuestionIn Exercises 53-66, begin by graphing the standard quadratic function, f(x) = x². Then use transformations of this graph to graph the given function. g(x) = x² - 2319views
Textbook QuestionIn Exercises 53-66, begin by graphing the standard quadratic function, f(x) = x². Then use transformations of this graph to graph the given function. g(x) = (x − 2)²244views
Textbook QuestionIn Exercises 55–59, use the graph of to graph each function g. g(x) = f(x + 2) + 3241views
Textbook QuestionIn Exercises 55–59, use the graph of to graph each function g. g(x) = -f(2x)252views
Textbook QuestionIn Exercises 60–63, begin by graphing the standard quadratic function, f(x) = x^2. Then use transformations of this graph to graph the given function. g(x) = x^2 + 2258views
Textbook QuestionIn Exercises 60–63, begin by graphing the standard quadratic function, f(x) = x^2. Then use transformations of this graph to graph the given function. r(x) = -(x + 1)^2245views
Textbook QuestionIn Exercises 53-66, begin by graphing the standard quadratic function, f(x) = x². Then use transformations of this graph to graph the given function. g(x) = (1/2)(x − 1)²244views
Textbook QuestionIn Exercises 64–66, begin by graphing the square root function, f(x) = √x. Then use transformations of this graph to graph the given function. g(x) = √(x + 3)211views
Textbook QuestionIn Exercises 53-66, begin by graphing the standard quadratic function, f(x) = x². Then use transformations of this graph to graph the given function. h(x) = (1/2) (x − 1)² – 1393views
Textbook QuestionIn Exercises 64–66, begin by graphing the square root function, f(x) = √x. Then use transformations of this graph to graph the given function. r(x) = 2√(x + 2)703views
Textbook QuestionIn Exercises 53-66, begin by graphing the standard quadratic function, f(x) = x². Then use transformations of this graph to graph the given function. h(x) = -2(x+2)²+1209views
Textbook QuestionGraph each function. See Examples 6–8 and the Summary of Graphing Techniques box following Example 9. ƒ(x)=x^2+2185views
Textbook QuestionIn Exercises 67-80, begin by graphing the square root function, f(x) = √x. Then use transformations of this graph to graph the given function. g(x) = √x + 1226views
Textbook QuestionIn Exercises 67-80, begin by graphing the square root function, f(x) = √x. Then use transformations of this graph to graph the given function. g(x) = √(x+1)226views
Textbook QuestionIn Exercises 67-80, begin by graphing the square root function, f(x) = √x. Then use transformations of this graph to graph the given function. h(x)=-√(x + 1)256views
Textbook QuestionConsider the following nonlinear system. Work Exercises 75 –80 in order. y = | x - 1 | y = x^2 - 4 How is the graph of y = | x - 1 | obtained by transforming the graph of y = | x |?203views
Textbook QuestionGraph each function. See Examples 6–8 and the Summary of Graphing Techniques box following Example 9. h(x)=-(x+1)^3178views
Textbook QuestionIn Exercises 67-80, begin by graphing the square root function, f(x) = √x. Then use transformations of this graph to graph the given function. h(x) = √(x+1)-1242views
Textbook QuestionIn Exercises 67-80, begin by graphing the square root function, f(x) = √x. Then use transformations of this graph to graph the given function. g(x) = 2√(x+1)-1205views
Textbook QuestionGraph each function. See Examples 6–8 and the Summary of Graphing Techniques box following Example 9. ƒ(x)=-3(x-2)^2+1184views
Textbook QuestionIn Exercises 81–94, begin by graphing the absolute value function, f(x) = |x|. Then use transformations of this graph to graph the given function. g(x) = |x|+3234views
Textbook QuestionIn Exercises 81–94, begin by graphing the absolute value function, f(x) = |x|. Then use transformations of this graph to graph the given function. g(x) = |x+3|239views
Textbook QuestionGraph each function. See Examples 6–8 and the Summary of Graphing Techniques box following Example 9. ƒ(x)=2√x+1203views
Textbook QuestionIn Exercises 81–94, begin by graphing the absolute value function, f(x) = |x|. Then use transformations of this graph to graph the given function. h(x) = |x + 3| - 2236views
Textbook QuestionGraph each function. See Examples 6–8 and the Summary of Graphing Techniques box following Example 9. ƒ(x)=3√x-2224views
Textbook QuestionIn Exercises 81–94, begin by graphing the absolute value function, f(x) = |x|. Then use transformations of this graph to graph the given function. h(x) = 2|x+3|230views
Textbook QuestionIn Exercises 81–94, begin by graphing the absolute value function, f(x) = |x|. Then use transformations of this graph to graph the given function. g(x) = -2|x+3|+2197views
Textbook QuestionEach of the following graphs is obtained from the graph of ƒ(x)=|x| or g(x)=√x by applying several of the transformations discussed in this section. Describe the transformations and give an equation for the graph. 217views
Textbook QuestionIn Exercises 95-106, begin by graphing the standard cubic function, f(x) = x³. Then use transformations of this graph to graph the given function. g(x) = x³-3213views
Textbook QuestionDescribe how the graph of each function can be obtained from the graph of ƒ(x) = |x|. g(x) = -|x|690views
Textbook QuestionIn Exercises 95-106, begin by graphing the standard cubic function, f(x) = x³. Then use transformations of this graph to graph the given function. g(x) = (x − 3)^3259views
Textbook QuestionLet ƒ(x) = 3x -4. Find an equation for each reflection of the graph of ƒ(x). across the x-axis349views
Textbook QuestionIn Exercises 95-106, begin by graphing the standard cubic function, f(x) = x³. Then use transformations of this graph to graph the given function. h(x) = -x³210views
Textbook QuestionLet ƒ(x) = 3x -4. Find an equation for each reflection of the graph of ƒ(x). across the y-axis197views
Textbook QuestionEach of the following graphs is obtained from the graph of ƒ(x)=|x| or g(x)=√x by applying several of the transformations discussed in this section. Describe the transformations and give an equation for the graph. 244views
Textbook QuestionThe graph of a function ƒ is shown in the figure. Sketch the graph of each function defined as follows. (a) y = ƒ(x) +3219views
Textbook QuestionThe graph of a function ƒ is shown in the figure. Sketch the graph of each function defined as follows. (b) y = ƒ(x-2)241views
Textbook QuestionThe graph of a function ƒ is shown in the figure. Sketch the graph of each function defined as follows. (c) y = ƒ(x+3) - 2364views
Textbook QuestionIn Exercises 95-106, begin by graphing the standard cubic function, f(x) = x³. Then use transformations of this graph to graph the given function. r(x) = (x − 2)³ +1210views
Textbook QuestionThe graph of a function ƒ is shown in the figure. Sketch the graph of each function defined as follows. (d) y = |ƒ(x)|327views
Textbook QuestionIn Exercises 107-118, begin by graphing the cube root function, f(x) = ∛x. Then use transformations of this graph to graph the given function. g(x) = ∛x+2421views
Textbook QuestionIn Exercises 107-118, begin by graphing the cube root function, f(x) = ∛x. Then use transformations of this graph to graph the given function. g(x) = ∛(x-2)735views
Textbook QuestionIn Exercises 107-118, begin by graphing the cube root function, f(x) = ∛x. Then use transformations of this graph to graph the given function. g(x) = (1/2)∛(x-2)214views
Textbook QuestionIn Exercises 107-118, begin by graphing the cube root function, f(x) = ∛x. Then use transformations of this graph to graph the given function. g(x) = (1/2)∛(x+2) - 2295views
Textbook QuestionIn Exercises 107-118, begin by graphing the cube root function, f(x) = ∛x. Then use transformations of this graph to graph the given function. ∛(-x-2)340views
Textbook QuestionIn Exercises 81–94, begin by graphing the absolute value function, f(x) = |x|. Then use transformations of this graph to graph the given function. g(x) = -|x + 4| +2399views
Multiple ChoiceWritten below (green dotted curve) is a graph of the function f(x)=x−2f\left(x\right)=\sqrt{x-2}f(x)=x−2. If g(x) (blue solid curve) is a reflection of f(x) about the y-axis what is the equation for g(x)?270views9rank
Multiple ChoiceThe green dotted curve below is a graph of the function f(x)f\left(x\right)f(x). Find the domain and range of g(x)g\left(x\right)g(x) (the blue solid curve), which is a transformation of f(x)f\left(x\right)f(x).494views4rank

 5:25m
5:25m