Join thousands of students who trust us to help them ace their exams!
Multiple Choice
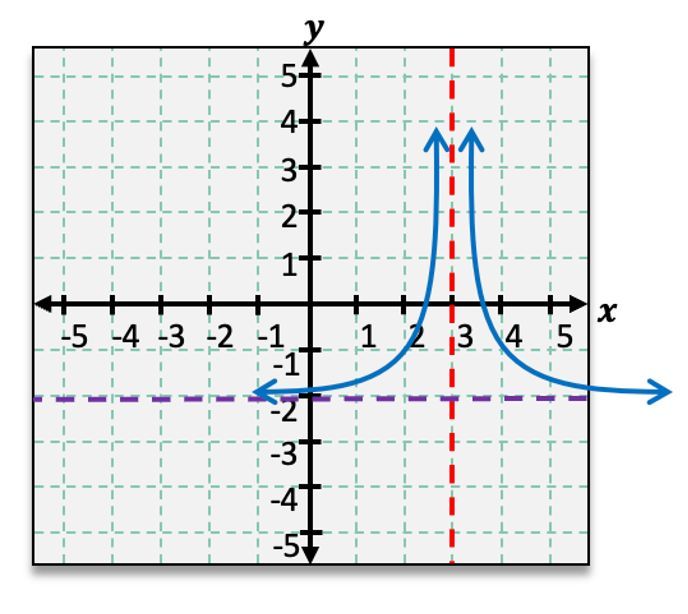
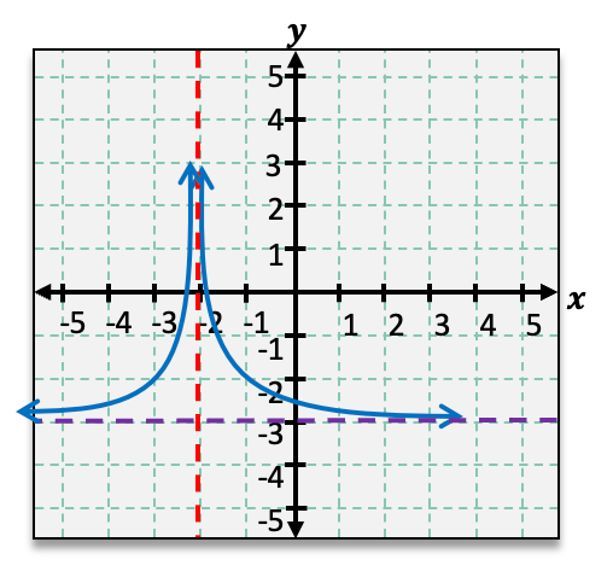
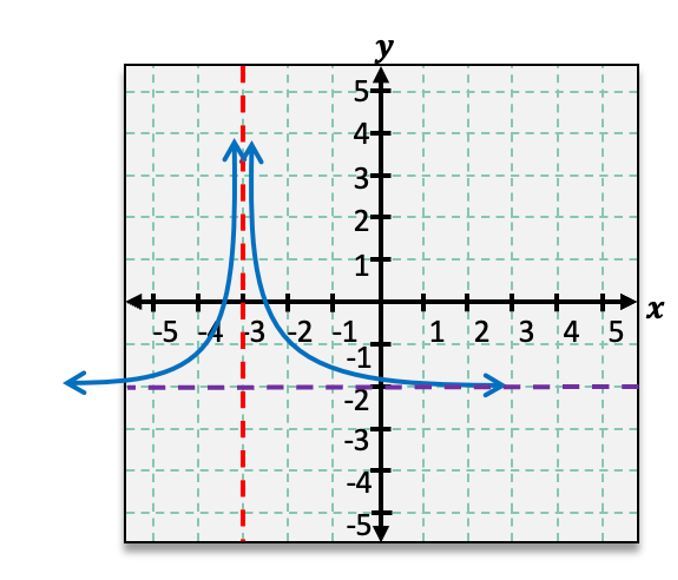
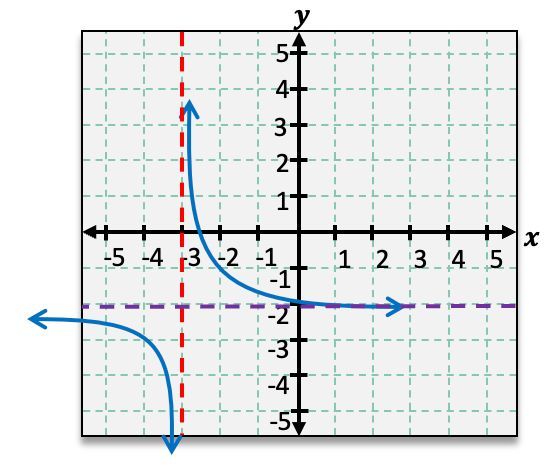
Graph the rational function using transformations. f(x)=(x+3)21−2
A
B
C
D
0 Comments
Verified step by step guidance
1
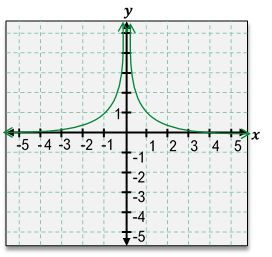
Identify the base function: The base function here is \( f(x) = \frac{1}{x^2} \), which is a rational function with a vertical asymptote at \( x = 0 \) and a horizontal asymptote at \( y = 0 \).
Apply horizontal shift: The function \( f(x) = \frac{1}{(x+3)^2} \) indicates a horizontal shift to the left by 3 units. This moves the vertical asymptote from \( x = 0 \) to \( x = -3 \).
Apply vertical shift: The function \( f(x) = \frac{1}{(x+3)^2} - 2 \) indicates a vertical shift downward by 2 units. This moves the horizontal asymptote from \( y = 0 \) to \( y = -2 \).
Analyze the transformations: The graph of \( f(x) = \frac{1}{(x+3)^2} - 2 \) will have a vertical asymptote at \( x = -3 \) and a horizontal asymptote at \( y = -2 \). The graph will approach these asymptotes but never touch them.
Sketch the graph: Start by drawing the asymptotes at \( x = -3 \) and \( y = -2 \). Then, sketch the curve of the function, which will be similar to \( \frac{1}{x^2} \) but shifted according to the transformations. The graph will be symmetric about the vertical asymptote.


 Verified step by step guidance
