Join thousands of students who trust us to help them ace their exams!
Multiple Choice
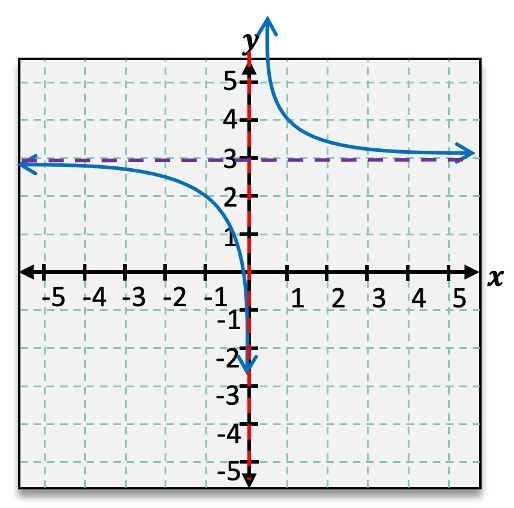
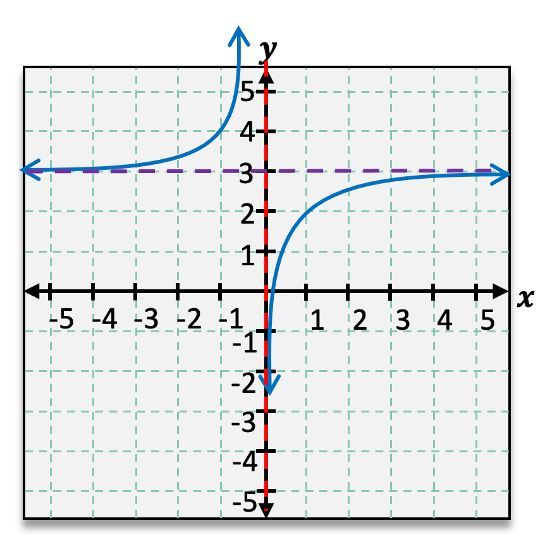
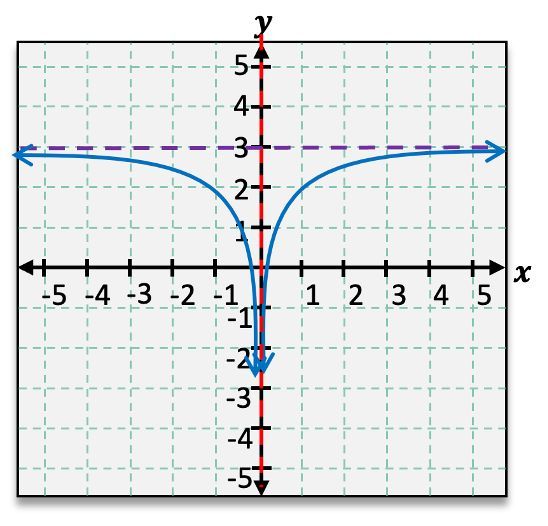
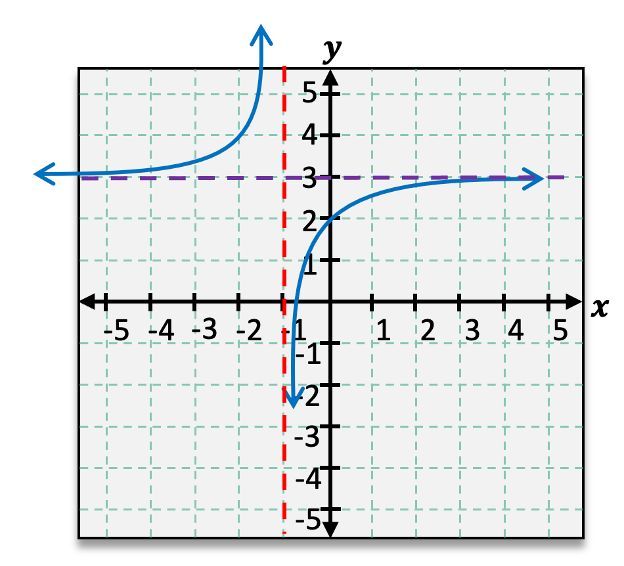
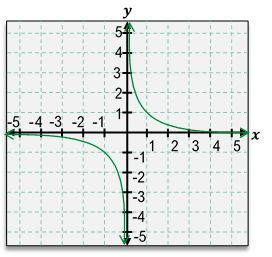
Graph the rational function using transformations. f(x)=−x1+3
A
B
C
D
0 Comments
Verified step by step guidance
1
Start with the basic rational function f(x) = -1/x, which has a vertical asymptote at x = 0 and a horizontal asymptote at y = 0.
Identify the transformations applied to the function. The given function is f(x) = -1/x + 3, which indicates a vertical shift.
The '+3' in the function indicates a vertical shift upwards by 3 units. This means the horizontal asymptote will move from y = 0 to y = 3.
The vertical asymptote remains unchanged at x = 0 because there is no horizontal shift in the function.
Graph the transformed function by plotting the new asymptotes: a vertical asymptote at x = 0 and a horizontal asymptote at y = 3. Then, sketch the curve approaching these asymptotes, reflecting the original shape of the function f(x) = -1/x.


 Verified step by step guidance
