Graph each function. Determine the largest open intervals of the domain over which each function is (a) increasing or (b) decreasing. ƒ(x)=(1/2)(x-2)2+4
Ch. 3 - Polynomial and Rational Functions

Chapter 4, Problem 19
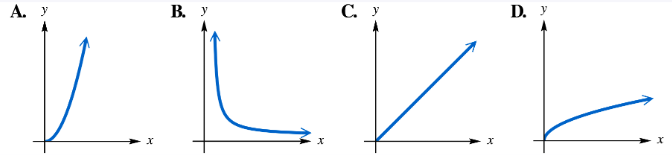
Match each statement with its corresponding graph in choices A–D. In each case, k > 0. y varies directly as the second power of x. (y=kx2)

Verified step by step guidance1
Identify the type of variation described: "y varies directly as the second power of x" means the relationship can be written as \(y = kx^{2}\), where \(k > 0\).
Recognize the shape of the graph for \(y = kx^{2}\): Since \(k\) is positive and the power of \(x\) is 2, the graph is a parabola opening upwards.
Recall key features of the parabola \(y = kx^{2}\): It is symmetric about the y-axis, passes through the origin (0,0), and as \(|x|\) increases, \(y\) increases quadratically.
Compare the given graph choices A–D to these characteristics: Look for the graph that shows a U-shaped curve opening upwards, symmetric about the y-axis, and passing through the origin.
Match the statement \(y = kx^{2}\) with the graph that fits these features, confirming it represents direct variation with the second power of \(x\).

Verified video answer for a similar problem:
This video solution was recommended by our tutors as helpful for the problem above.
Video duration:
2mWas this helpful?
Key Concepts
Here are the essential concepts you must grasp in order to answer the question correctly.
Direct Variation
Direct variation describes a relationship where one variable is equal to a constant multiplied by another variable raised to a power. In this case, y varies directly as x squared, meaning y = kx², where k is a positive constant. This implies that as x increases, y changes proportionally to the square of x.
Recommended video:
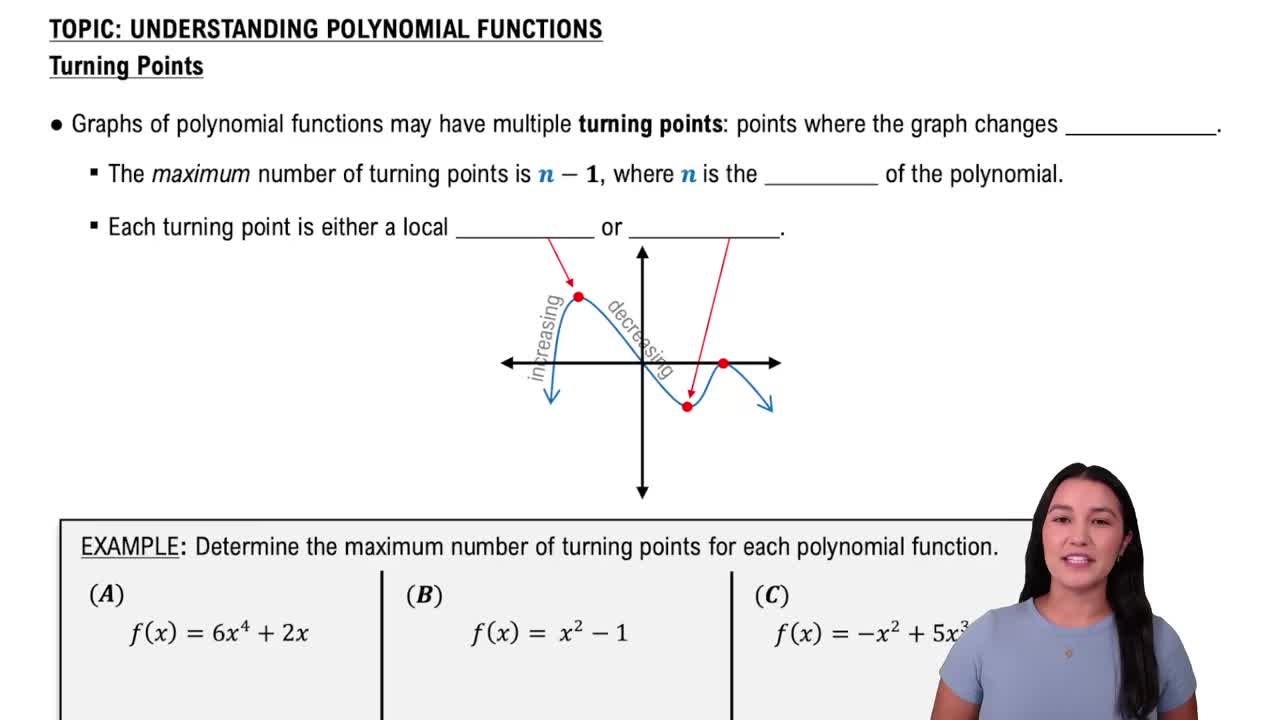
Maximum Turning Points of a Polynomial Function
Quadratic Functions and Their Graphs
A quadratic function has the form y = ax² + bx + c, and its graph is a parabola. For y = kx² with k > 0, the parabola opens upward and is symmetric about the y-axis. Understanding the shape and orientation of this graph helps in matching the equation to its correct graph.
Recommended video:
Graphs of Logarithmic Functions
Effect of the Constant k on the Graph
The constant k in y = kx² affects the steepness or width of the parabola. When k > 0, the parabola opens upward; larger values of k make the parabola narrower, while smaller values make it wider. Recognizing how k influences the graph aids in identifying the correct match among given options.
Recommended video:
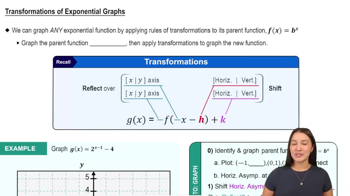
Transformations of Exponential Graphs
Related Practice
Textbook Question
863
views
Textbook Question
Use synthetic division to perform each division. (x4 - 3x3 - 4x2 + 12x) / x-2
525
views
Textbook Question
Write each formula as an English phrase using the word varies or proportional. C=2πr, where C is the circumference of a circle of radius r.
559
views
Textbook Question
Use the factor theorem and synthetic division to determine whether the second polynomial is a factor of the first.
700
views
Textbook Question
Graph the following on the same coordinate system.
(a) y = x2
(b) y = 3x2
(c) y = 1/3x2
(d) How does the coefficient of x2 affect the shape of the graph?
1164
views
Textbook Question
Use the factor theorem and synthetic division to determine whether the second polynomial is a factor of the first. See Example 1.
398
views