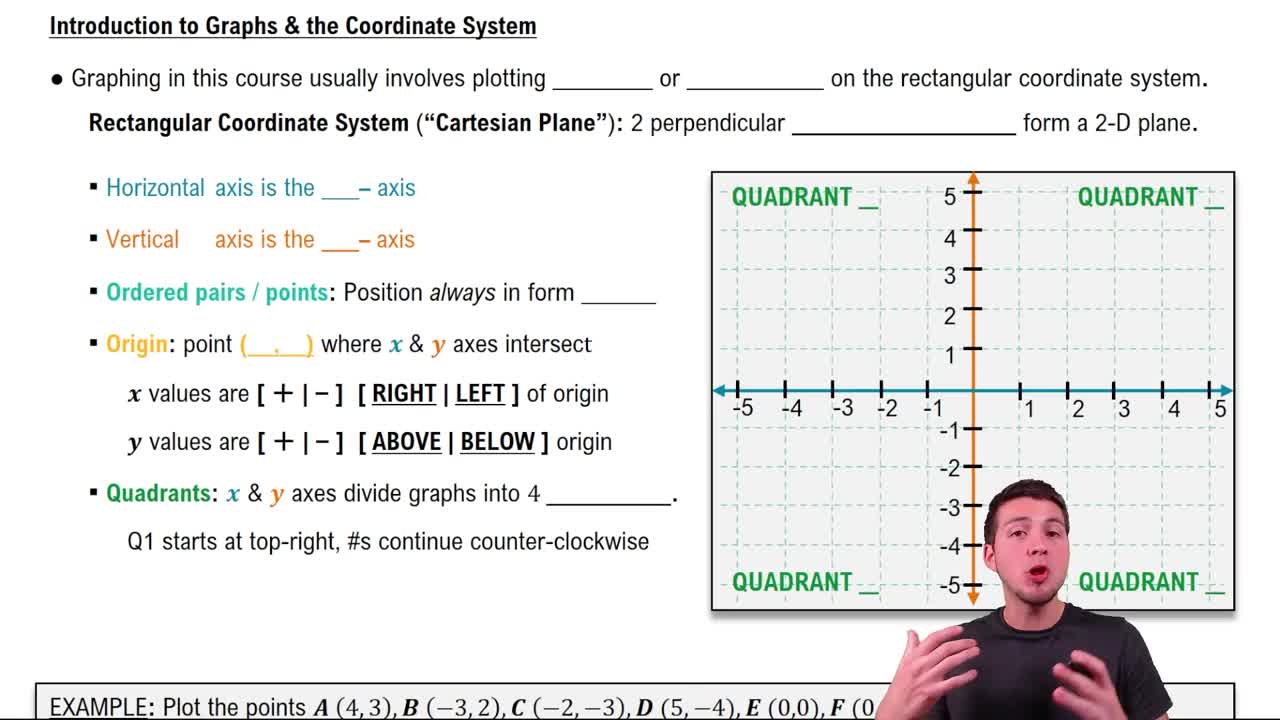
Use the graph to evaluate each expression. See Example 3(a). (ƒg)(1)
Verified step by step guidance
1
Understand that (ƒg)(1) means the composition of functions: ƒ(g(1)). This means you first find g(1), then use that result as the input for f.
Look at the graph and find the value of g(1). Locate x = 1 on the horizontal axis, then find the corresponding y-value on the g(x) curve (the blue line).
Once you have the value of g(1), use this value as the input for the function f. That is, find f(g(1)) by locating this value on the x-axis and then finding the corresponding y-value on the f(x) curve (the red line).
Read the y-value from the f(x) curve at x = g(1). This y-value is the value of (ƒg)(1).
Summarize the process: (ƒg)(1) = f(g(1)) = the y-value on the red curve at the x-value found from the blue curve at x=1.
Verified video answer for a similar problem:
This video solution was recommended by our tutors as helpful for the problem above
Video duration:
3m
Play a video:
0 Comments
Key Concepts
Here are the essential concepts you must grasp in order to answer the question correctly.
Function Composition
Function composition involves applying one function to the result of another, denoted as (ƒg)(x) = f(g(x)). To evaluate (ƒg)(1), first find g(1), then use that value as the input for f. This concept is essential for understanding how two functions combine to form a new function.
To evaluate functions using a graph, locate the input value on the x-axis, then find the corresponding y-value on the function's curve. This y-value represents the function's output. Accurate reading from the graph is crucial for correctly evaluating expressions like f(g(1)).
Function notation, such as f(x) and g(x), represents the output of functions f and g for input x. Recognizing how to interpret and manipulate these notations helps in evaluating expressions and understanding relationships between functions, especially in compositions.

 Verified step by step guidance
 4:56
4:56