Ch. 2 - Graphs and Functions
Lial - College Algebra 13th Edition
Lial13th EditionCollege AlgebraISBN: 9780136881063Not the one you use?Change textbook
Chapter 3, Problem 25

Graph each piecewise-defined function.
f(x)={3if x11if x>1f(x) =\(\begin{cases}\)-3 & \(\text{if }\) x \(\leq\) 1 \\-1 & \(\text{if }\) x > 1\(\end{cases}\)

Verified step by step guidance
1
Step 1: Understand the piecewise function definition. The function f(x) is defined as 5 when x is less than or equal to 2, and 2 when x is greater than 2.
Step 2: For the first piece, plot the constant value f(x) = 5 for all x-values less than or equal to 2. This will be a horizontal line at y = 5 extending to the left from x = 2, including the point at x = 2.
Step 3: For the second piece, plot the constant value f(x) = 2 for all x-values greater than 2. This will be a horizontal line at y = 2 extending to the right from x = 2, but not including the point at x = 2.
Step 4: At x = 2, use a closed dot (●) on the line y = 5 to indicate that the function value is 5 at x = 2, and an open dot (○) on the line y = 2 to show that the function does not take the value 2 at x = 2.
Step 5: Label the axes and ensure the graph clearly shows the two horizontal segments with the correct dots at x = 2 to represent the piecewise function accurately.

Verified video answer for a similar problem:

This video solution was recommended by our tutors as helpful for the problem above.
Video duration:
3m
Was this helpful?

Key Concepts

Here are the essential concepts you must grasp in order to answer the question correctly.

Piecewise-Defined Functions

A piecewise-defined function is a function composed of different expressions depending on the input value's domain. Each piece applies to a specific interval or condition, and the function's value changes accordingly. Understanding how to interpret and graph these pieces is essential.
Recommended video:
3:51
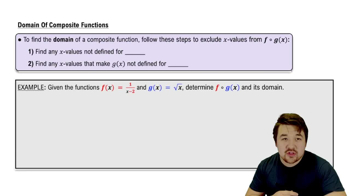
Domain Restrictions of Composed Functions

Domain and Inequality Notation

The domain specifies the set of input values for which each piece of the function applies, often expressed using inequalities like ≤ or >. Correctly identifying these intervals ensures accurate graphing and understanding of where each function piece is valid.
Recommended video:
05:18
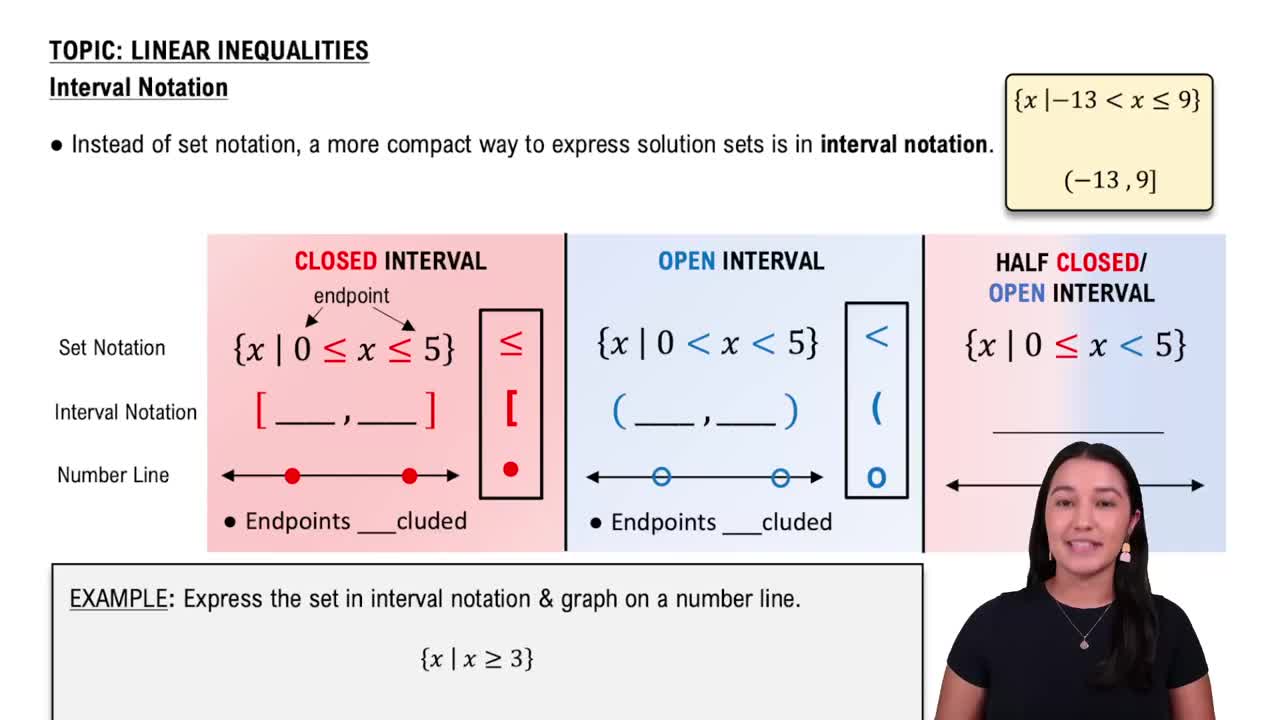
Interval Notation

Graphing Constant Functions

When a function outputs a constant value over an interval, its graph is a horizontal line segment at that value. For piecewise functions with constant pieces, graphing involves drawing horizontal lines over the specified domain intervals, paying attention to open or closed endpoints.
Recommended video:
5:26
Graphs of Logarithmic Functions