Ch. 2 - Graphs and Functions
Lial - College Algebra 13th Edition
Lial13th EditionCollege AlgebraISBN: 9780136881063Not the one you use?Change textbook
Chapter 3, Problem 39

Graph each equation. 2x +5y = 20

Verified step by step guidance
1
Rewrite the given equation in slope-intercept form, which is \(y = mx + b\), where \(m\) is the slope and \(b\) is the y-intercept. Start with the equation: \$2x + 5y = 20$.
Isolate the \(y\) term by subtracting \$2x\( from both sides: \)5y = -2x + 20$.
Divide every term by 5 to solve for \(y\): \(y = \frac{-2}{5}x + 4\).
Identify the slope and y-intercept from the equation \(y = -\frac{2}{5}x + 4\). The slope \(m\) is \(-\frac{2}{5}\) and the y-intercept \(b\) is 4.
Plot the y-intercept point \((0, 4)\) on the graph. Then use the slope \(-\frac{2}{5}\) to find another point by moving down 2 units and right 5 units from the y-intercept. Draw a straight line through these points to graph the equation.

Verified video answer for a similar problem:

This video solution was recommended by our tutors as helpful for the problem above.
Video duration:
2m
Was this helpful?

Key Concepts

Here are the essential concepts you must grasp in order to answer the question correctly.

Linear Equations in Two Variables

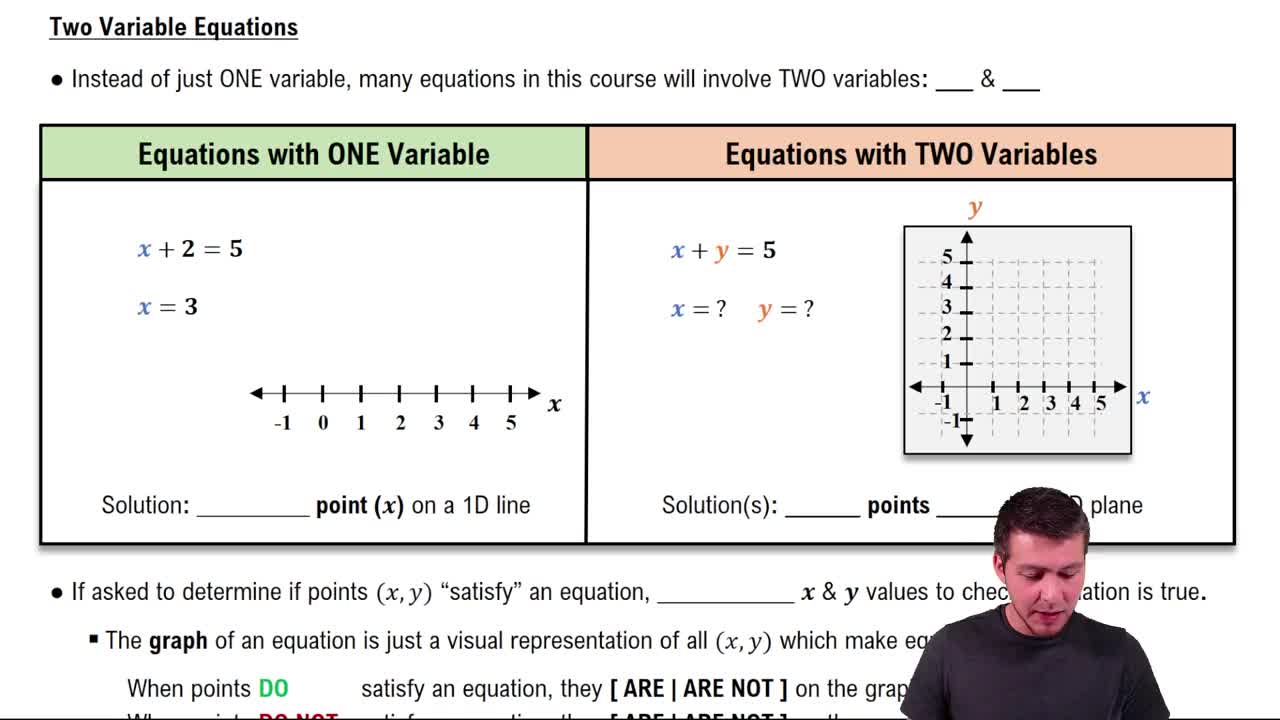
A linear equation in two variables, like 2x + 5y = 20, represents a straight line on the coordinate plane. Each solution (x, y) satisfies the equation, and the graph is the set of all such points.
Recommended video:
Guided course
05:28
Equations with Two Variables

Slope-Intercept Form

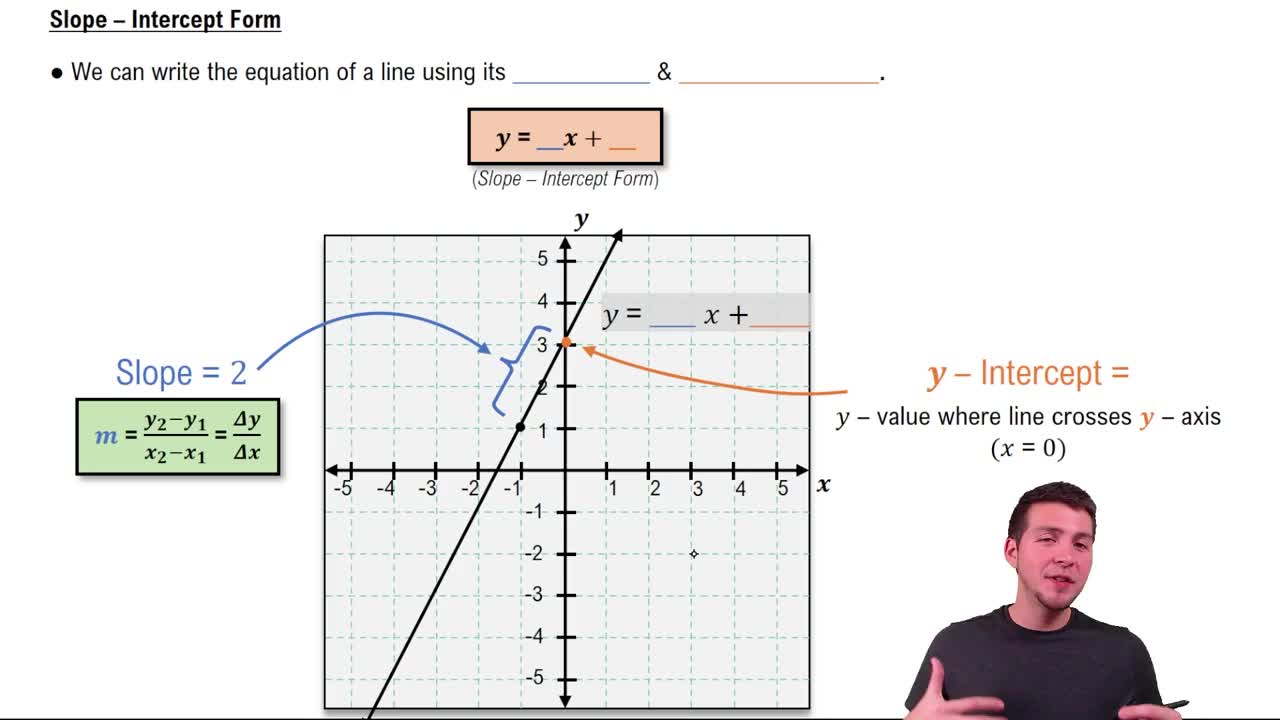
Rearranging the equation into slope-intercept form (y = mx + b) helps identify the slope (m) and y-intercept (b), making it easier to graph the line by starting at the intercept and using the slope to find other points.
Recommended video:
Guided course
03:56
Slope-Intercept Form

Plotting Points and Drawing the Graph

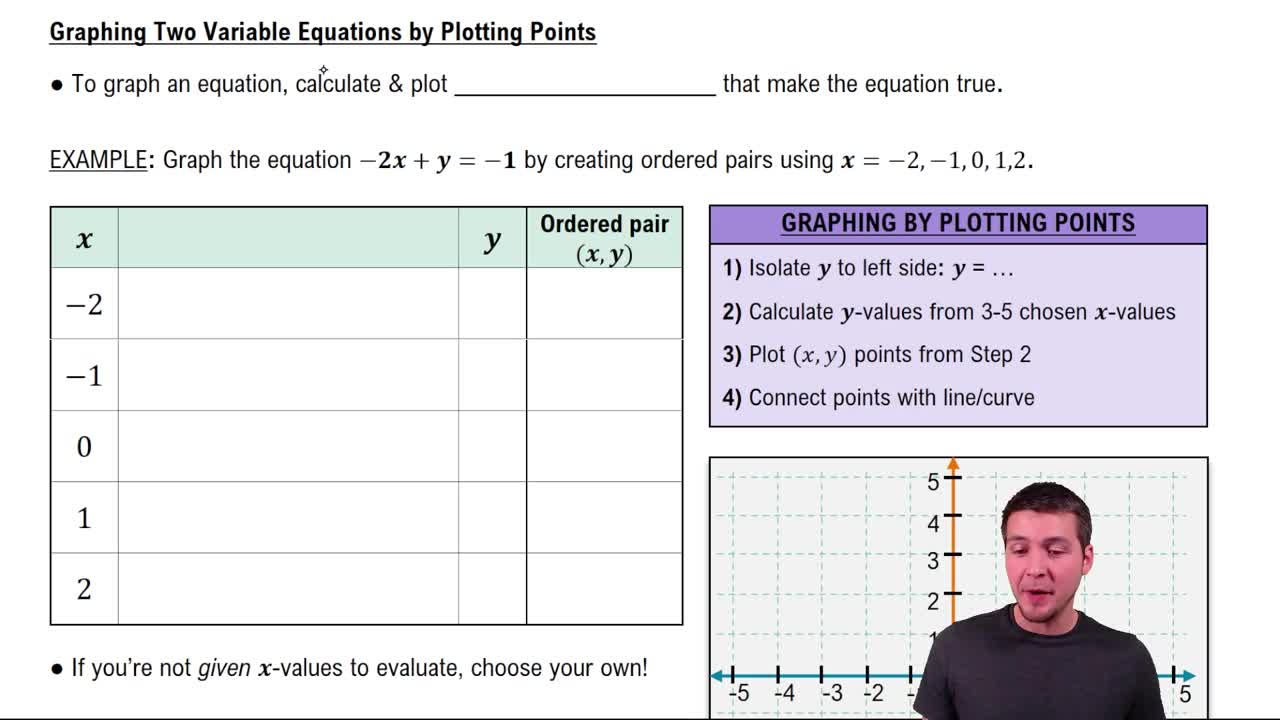
To graph the equation, find at least two points that satisfy it by choosing values for x or y, plot these points on the coordinate plane, and draw a straight line through them to represent all solutions.
Recommended video:
Guided course
04:29
Graphing Equations of Two Variables by Plotting Points