2. Graphs of Equations
Lines
Problem 49b
Textbook Question
Textbook QuestionThe graph of a linear function f is shown. (a) Identify the slope, y-intercept, and x-intercept. (b) Write an equation that defines f. 
 Verified Solution
This video solution was recommended by our tutors as helpful for the problem above
Video duration:
7mWas this helpful?
Key Concepts
Here are the essential concepts you must grasp in order to answer the question correctly.
Slope
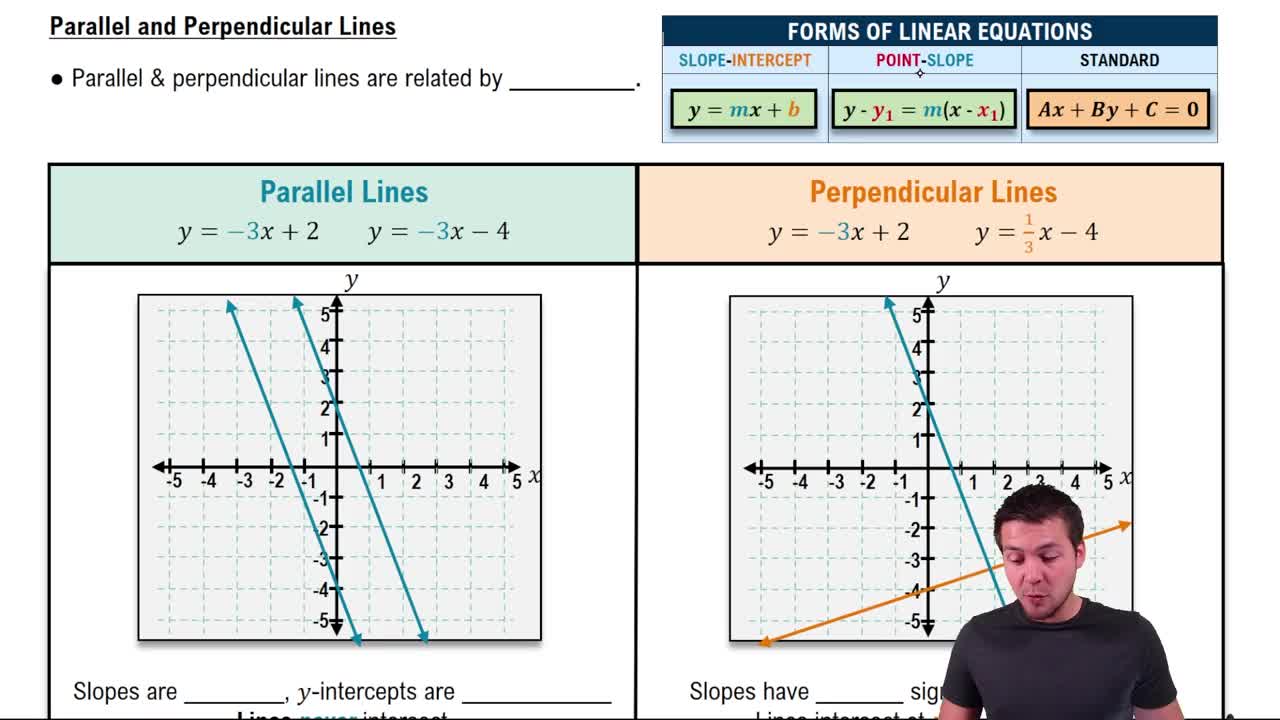
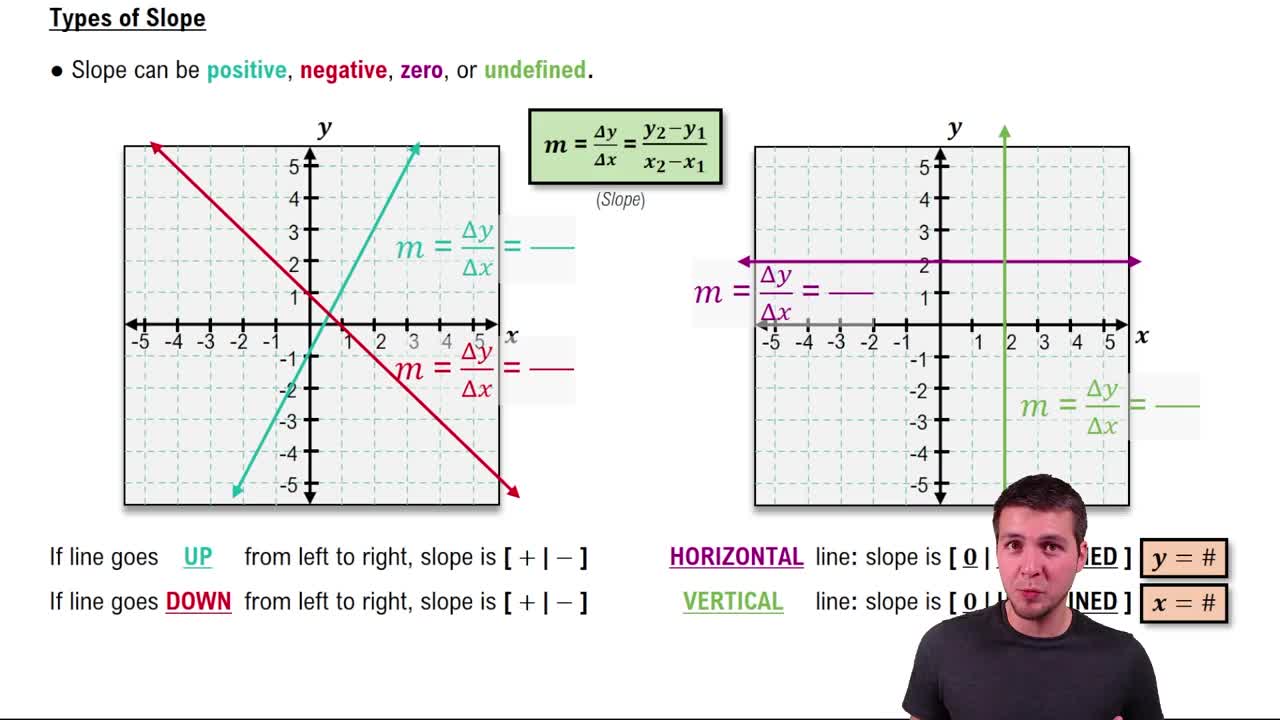
The slope of a linear function represents the rate of change of the function, indicating how much the y-value changes for a unit change in the x-value. It is calculated as the rise over run, or the change in y divided by the change in x between two points on the line. A positive slope indicates that the function is increasing, while a negative slope indicates a decreasing function.
Recommended video:
Guided course
 05:17
05:17Types of Slope
Intercepts
Intercepts are the points where the graph of a function intersects the axes. The y-intercept is the point where the graph crosses the y-axis, indicating the value of the function when x is zero. The x-intercept is where the graph crosses the x-axis, showing the value of x when the function equals zero. Identifying these points is crucial for understanding the behavior of the linear function.
Recommended video:
Guided course
 04:08
04:08Graphing Intercepts
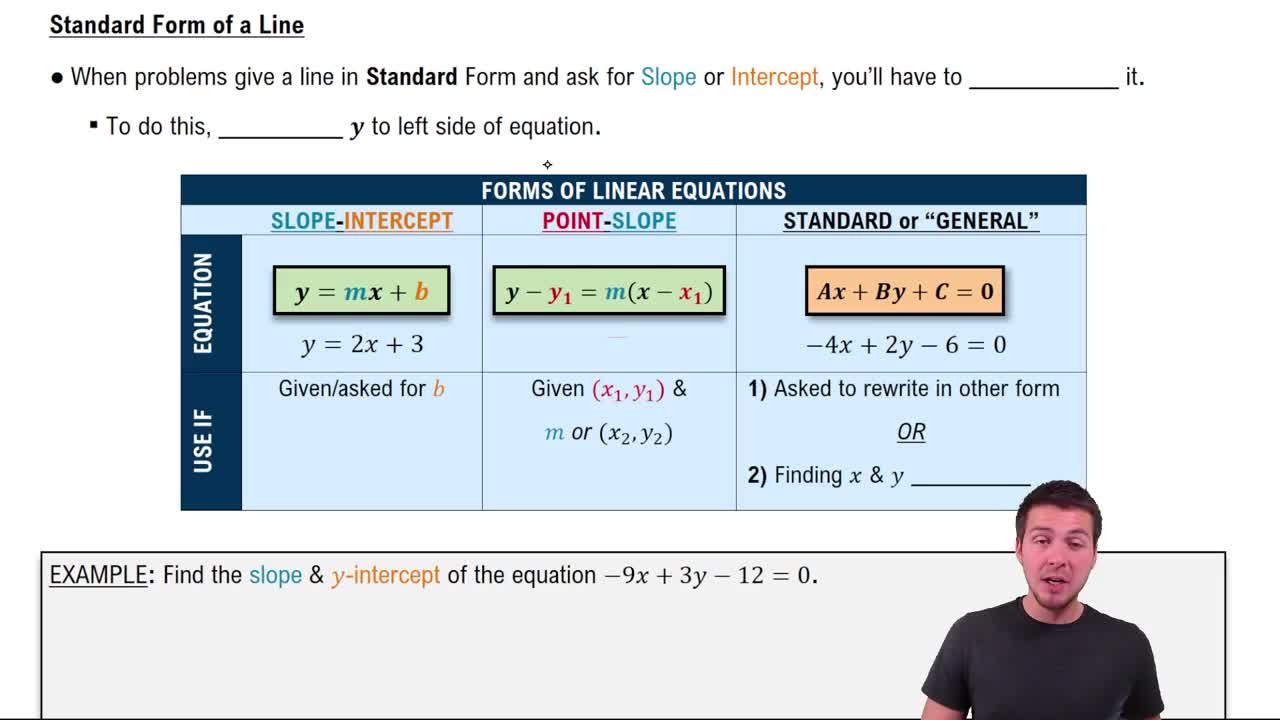
Linear Equation
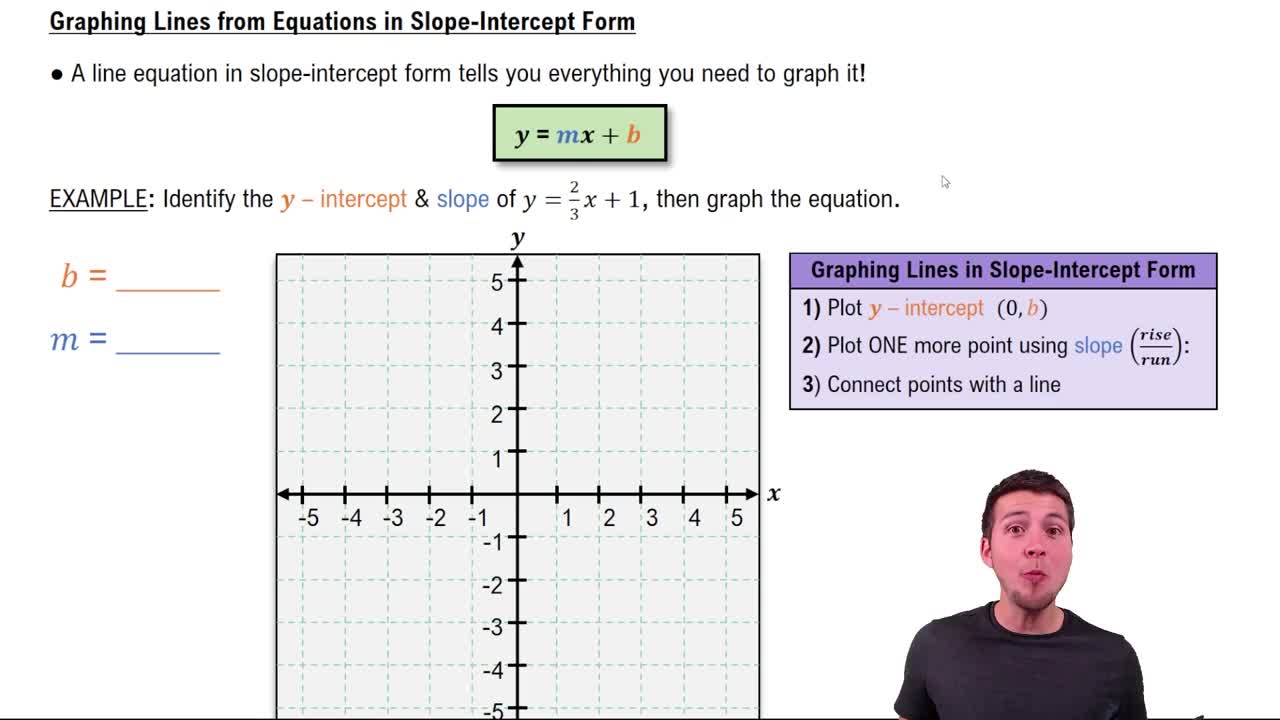
A linear equation is an algebraic expression that represents a straight line when graphed. It is typically written in the form y = mx + b, where m is the slope and b is the y-intercept. This equation allows us to predict the value of y for any given x, and understanding how to derive this equation from a graph is essential for analyzing linear functions.
Recommended video:
 06:00
06:00Categorizing Linear Equations
 6:49m
6:49mWatch next
Master The Slope of a Line with a bite sized video explanation from Patrick Ford
Start learningRelated Videos
Related Practice