0. Functions
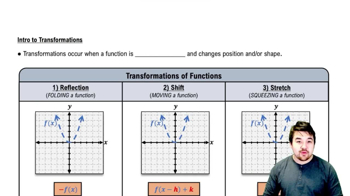
Transformations
Problem 53f
Textbook Question
Shifting and Scaling Graphs
Suppose the graph of g is given. Write equations for the graphs that are obtained from the graph of g by shifting, scaling, or reflecting, as indicated.
f. Compress horizontally by a factor of 5
 Verified step by step guidance
1
Start with the function g(x), which represents the original graph.
To compress the graph horizontally by a factor of 5, you need to modify the input variable x in the function g(x).
The horizontal compression by a factor of 5 means that every x-value is divided by 5. This is achieved by replacing x with 5x in the function.
Thus, the new function that represents the horizontally compressed graph is g(5x).
This transformation will make the graph appear narrower, as each point on the graph is now closer to the y-axis.
Verified video answer for a similar problem:This video solution was recommended by our tutors as helpful for the problem above
Video duration:
1mWas this helpful?
Key Concepts
Here are the essential concepts you must grasp in order to answer the question correctly.
Horizontal Compression
Horizontal compression refers to the transformation of a graph where the x-coordinates of points on the graph are multiplied by a factor less than 1. In this case, compressing horizontally by a factor of 5 means that for every point (x, g(x)) on the graph of g, the new point will be (x/5, g(x)). This transformation effectively 'squeezes' the graph towards the y-axis.
Recommended video:

 04:50
04:50Critical Points
Function Transformation
Function transformations involve changing the position or shape of a graph through various operations such as shifting, scaling, or reflecting. Each transformation can be represented mathematically, allowing us to derive new functions from existing ones. Understanding these transformations is crucial for predicting how the graph will behave after modifications.
Recommended video:
 5:25
5:25Intro to Transformations
Graph of a Function
The graph of a function is a visual representation of the relationship between the input (x-values) and output (y-values) of the function. It provides insight into the function's behavior, including its intercepts, slopes, and overall shape. Analyzing the graph helps in understanding how transformations like shifting and scaling affect the function's characteristics.
Recommended video:
 5:53
5:53Graph of Sine and Cosine Function
 5:25m
5:25mWatch next
Master Intro to Transformations with a bite sized video explanation from Nick
Start learningRelated Videos
Related Practice
