Graphing functions Use the guidelines of this section to make a complete graph of f. f(x) = x²/(x - 2)
Verified step by step guidance
1
Identify the domain of the function f(x) = x²/(x - 2). The function is undefined where the denominator is zero, so set x - 2 = 0 and solve for x to find the vertical asymptote at x = 2.
Determine the x-intercepts by setting the numerator equal to zero: x² = 0. Solve for x to find the x-intercept at x = 0.
Find the y-intercept by evaluating the function at x = 0: f(0) = 0²/(0 - 2). This confirms the y-intercept is also at (0, 0).
Analyze the end behavior of the function by considering the limits as x approaches positive and negative infinity. Since the degree of the numerator is greater than the degree of the denominator, the function will have an oblique asymptote. Perform polynomial long division to find the equation of the oblique asymptote.
Sketch the graph using the information gathered: plot the intercepts, draw the vertical asymptote at x = 2, and sketch the behavior near the asymptotes and at infinity, ensuring the graph approaches the oblique asymptote as x goes to positive or negative infinity.
Verified video answer for a similar problem:
This video solution was recommended by our tutors as helpful for the problem above
Video duration:
17m
Play a video:
0 Comments
Key Concepts
Here are the essential concepts you must grasp in order to answer the question correctly.
Function Behavior
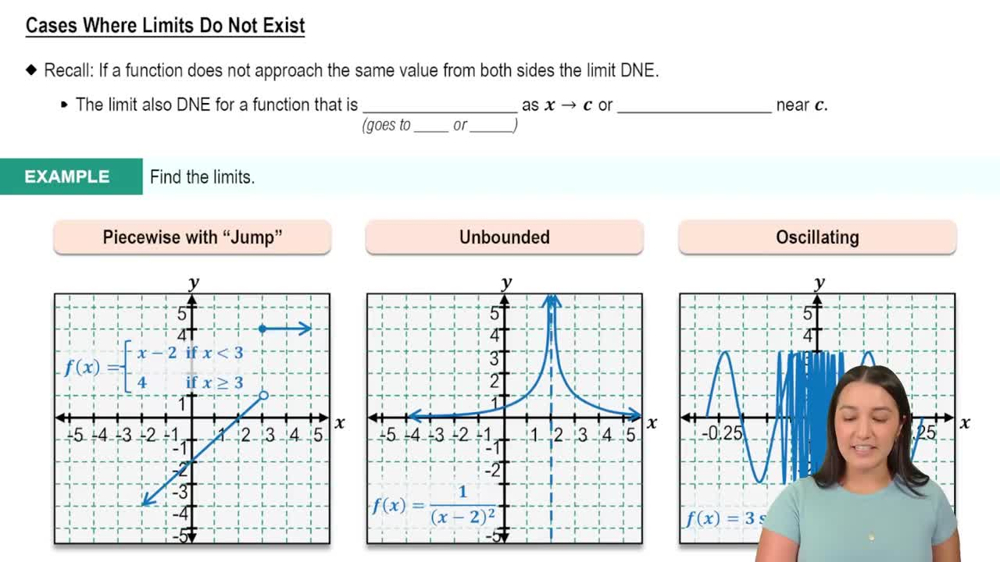
Understanding the behavior of the function f(x) = x²/(x - 2) is crucial. This includes identifying its domain, range, and any asymptotes. The function is undefined at x = 2, which creates a vertical asymptote, and analyzing the limits as x approaches this value helps in understanding the graph's behavior near the asymptote.
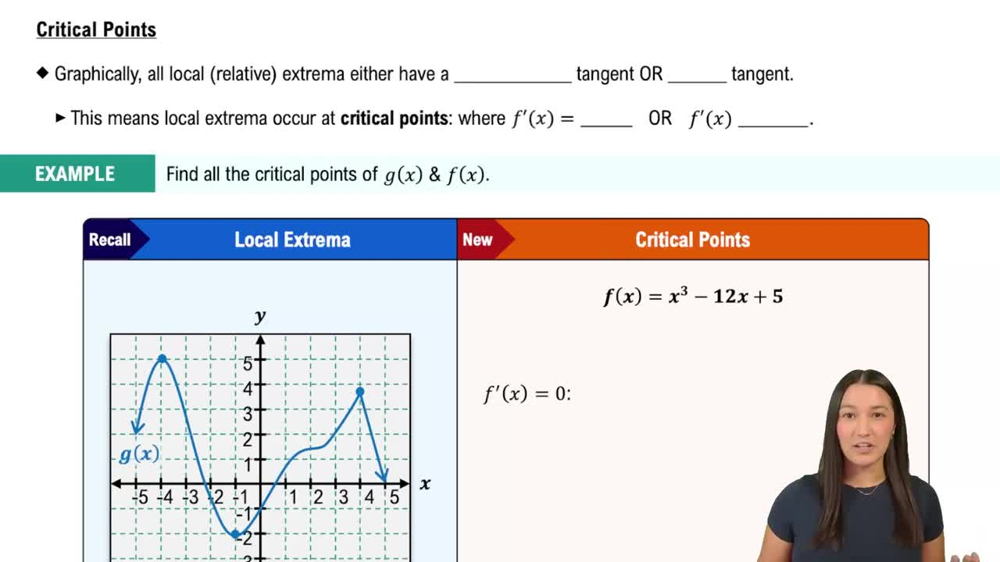
Finding critical points involves taking the derivative of the function and setting it to zero. This helps identify local maxima and minima, which are essential for sketching the graph accurately. Analyzing the first derivative test can also indicate where the function is increasing or decreasing.
End behavior describes how the function behaves as x approaches positive or negative infinity. For rational functions like f(x) = x²/(x - 2), examining the leading terms helps predict the horizontal asymptote and overall shape of the graph. This understanding is vital for completing the graph accurately.

 Verified step by step guidance
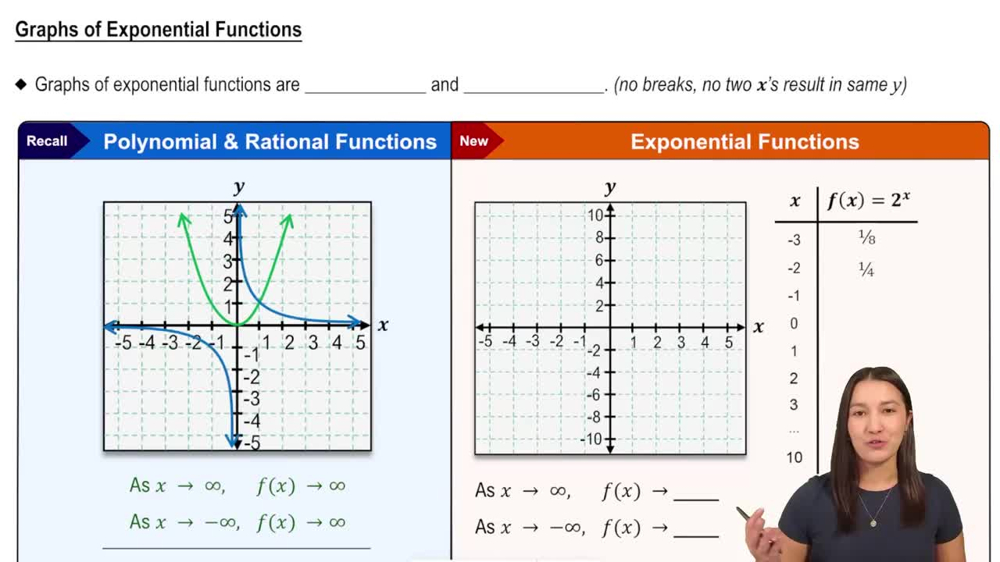
 5:46
5:46