4. Applications of Derivatives
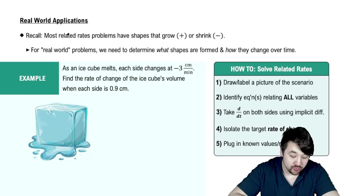
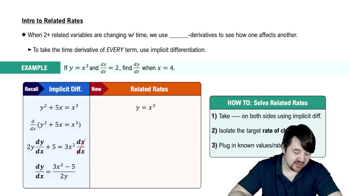
Related Rates
Problem 3.7.104b
Textbook Question
{Use of Tech} A mixing tank A 500-liter (L) tank is filled with pure water. At time t=0, a salt solution begins flowing into the tank at a rate of 5 L/min. At the same time, the (fully mixed) solution flows out of the tank at a rate of 5.5 L/min. The mass of salt in grams in the tank at any time t≥0 is given by M(t) = 250(1000−t)(1−10−³⁰(1000−t)¹⁰) and the volume of solution in the tank is given by V(t) = 500-0.5t.
b. Graph the volume function and verify that the tank is empty when t=1000 min.
 Verified step by step guidance
1
Step 1: Understand the volume function V(t) = 500 - 0.5t, which represents the volume of the solution in the tank at any time t. The initial volume is 500 L, and it decreases by 0.5 L per minute due to the outflow rate being higher than the inflow rate.
Step 2: To graph the volume function V(t), identify key points. Start with the initial condition at t = 0, where V(0) = 500 L. Then, find the volume at other significant times, such as t = 1000 min.
Step 3: Calculate V(1000) to verify when the tank is empty. Substitute t = 1000 into the volume function: V(1000) = 500 - 0.5(1000). Simplify this expression to find the volume at t = 1000.
Step 4: Plot the graph of V(t) using the points calculated. The graph should be a straight line with a negative slope, starting at (0, 500) and ending at (1000, 0).
Step 5: Verify that the tank is empty at t = 1000 by confirming that V(1000) = 0. This confirms that the volume function correctly models the situation where the tank is empty at 1000 minutes.
Verified video answer for a similar problem:This video solution was recommended by our tutors as helpful for the problem above
Video duration:
3mWas this helpful?
Key Concepts
Here are the essential concepts you must grasp in order to answer the question correctly.
Volume Function
The volume function V(t) describes how the volume of liquid in the tank changes over time. In this case, V(t) = 500 - 0.5t indicates that the tank starts with 500 liters and decreases by 0.5 liters per minute due to the outflow being greater than the inflow. Understanding this function is crucial for determining when the tank will be empty, which occurs when V(t) = 0.
Recommended video:
 06:21
06:21Properties of Functions
Graphing Functions
Graphing functions involves plotting the relationship between the independent variable (time t) and the dependent variable (volume V). By creating a graph of V(t), one can visually analyze the behavior of the volume over time, including identifying key points such as when the volume reaches zero, confirming the tank's emptying at t=1000 minutes.
Recommended video:
 5:53
5:53Graph of Sine and Cosine Function
Limits and Continuity
Limits and continuity are fundamental concepts in calculus that help analyze the behavior of functions as they approach specific points. In this context, understanding the limit of the volume function as time approaches 1000 minutes is essential to confirm that the tank indeed becomes empty, reinforcing the concept that a continuous function can be evaluated at its endpoints.
Recommended video:
 05:34
05:34Intro to Continuity

Related Videos
Related Practice