1. Limits and Continuity
Introduction to Limits
Problem 2.2.29
Textbook Question
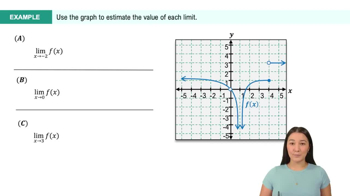
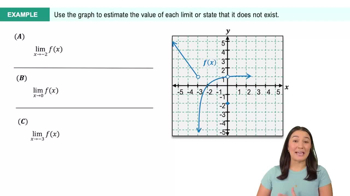
Textbook QuestionUse a graph of f to estimate or to show that the limit does not exist. Evaluate f(x) near to support your conjecture.
 Verified Solution
This video solution was recommended by our tutors as helpful for the problem above
Video duration:
5mWas this helpful?
Key Concepts
Here are the essential concepts you must grasp in order to answer the question correctly.
Limit of a Function
The limit of a function describes the behavior of the function as the input approaches a certain value. It is denoted as lim(x→a) f(x) and indicates what value f(x) approaches as x gets closer to a. Understanding limits is crucial for analyzing continuity and differentiability, as well as for evaluating functions that may not be defined at certain points.
Recommended video:

 06:11
06:11Limits of Rational Functions: Denominator = 0
Continuity
A function is continuous at a point if the limit of the function as it approaches that point equals the function's value at that point. For the function f(x) to be continuous at x = a, it must satisfy three conditions: f(a) must be defined, the limit as x approaches a must exist, and both must be equal. Discontinuities can lead to limits that do not exist or are undefined.
Recommended video:
 05:34
05:34Intro to Continuity
Graphical Interpretation of Limits
Using a graph to estimate limits involves observing the behavior of the function as it approaches a specific x-value. By analyzing the graph, one can identify trends, such as whether the function approaches a finite value, diverges, or oscillates. This visual approach aids in understanding the concept of limits and can provide insights into the existence or non-existence of limits at certain points.
Recommended video:
 6:47
6:47Finding Limits Numerically and Graphically
 6:47m
6:47mWatch next
Master Finding Limits Numerically and Graphically with a bite sized video explanation from Callie
Start learning