Table of contents
- 0. Functions7h 52m
- Introduction to Functions16m
- Piecewise Functions10m
- Properties of Functions9m
- Common Functions1h 8m
- Transformations5m
- Combining Functions27m
- Exponent rules32m
- Exponential Functions28m
- Logarithmic Functions24m
- Properties of Logarithms34m
- Exponential & Logarithmic Equations35m
- Introduction to Trigonometric Functions38m
- Graphs of Trigonometric Functions44m
- Trigonometric Identities47m
- Inverse Trigonometric Functions48m
- 1. Limits and Continuity2h 2m
- 2. Intro to Derivatives1h 33m
- 3. Techniques of Differentiation3h 18m
- 4. Applications of Derivatives2h 38m
- 5. Graphical Applications of Derivatives6h 2m
- 6. Derivatives of Inverse, Exponential, & Logarithmic Functions2h 37m
- 7. Antiderivatives & Indefinite Integrals1h 26m
- 8. Definite Integrals4h 44m
- 9. Graphical Applications of Integrals2h 27m
- 10. Physics Applications of Integrals 2h 22m
0. Functions
Piecewise Functions
Problem 31
Textbook Question
Piecewise linear functions Graph the following functions.
 Verified step by step guidance
1
Step 1: Understand the piecewise function definition. The function \( f(x) \) is defined as \( 3x - 1 \) for \( x \leq 0 \) and \( -2x - 1 \) for \( x > 0 \).
Step 2: Graph the first piece of the function, \( 3x - 1 \), for \( x \leq 0 \). This is a linear function with a slope of 3 and a y-intercept of -1. Plot the line starting from the y-intercept at (0, -1) and extend it to the left.
Step 3: Graph the second piece of the function, \( -2x - 1 \), for \( x > 0 \). This is a linear function with a slope of -2 and a y-intercept of -1. Plot the line starting from the y-intercept at (0, -1) and extend it to the right.
Step 4: Consider the point where the two pieces meet at \( x = 0 \). For \( x = 0 \), the value from the first piece is \( 3(0) - 1 = -1 \). Since the condition is \( x \leq 0 \), the point (0, -1) is included in the graph.
Step 5: Combine the two pieces on the graph. The graph will have a solid point at (0, -1) for the first piece and an open point at (0, -1) for the second piece, indicating that the second piece does not include \( x = 0 \).
 Verified video answer for a similar problem:
This video solution was recommended by our tutors as helpful for the problem above
Video duration:
7mPlay a video:
Was this helpful?
Key Concepts
Here are the essential concepts you must grasp in order to answer the question correctly.
Piecewise Functions
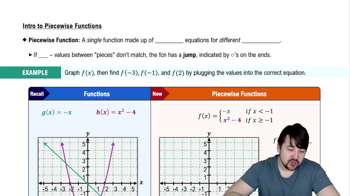
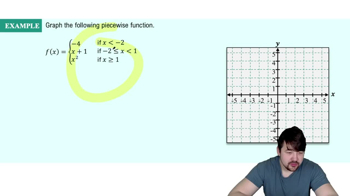
Piecewise functions are defined by different expressions based on the input value. In this case, the function f(x) has two distinct linear equations: one for x less than or equal to 0, and another for x greater than 0. Understanding how to interpret and graph these functions requires recognizing the conditions under which each piece applies.
Recommended video:

Piecewise Functions
Graphing Linear Functions
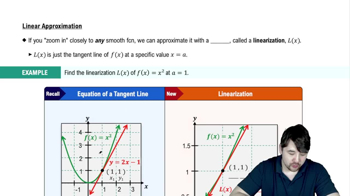
Graphing linear functions involves plotting points that satisfy the linear equations and connecting them to form straight lines. Each piece of the piecewise function can be graphed separately, taking care to indicate where each piece is valid. The slopes and intercepts of the lines are crucial for accurately representing the function on a coordinate plane.
Recommended video:

Linearization
Continuity and Discontinuity
Continuity refers to whether a function is unbroken at a point, while discontinuity indicates a 'jump' or break in the graph. For piecewise functions, it is essential to check the endpoints where the pieces meet, as this can affect the overall behavior of the function. In this case, examining the function at x = 0 will reveal if it is continuous or if there is a jump between the two linear pieces.
Recommended video:

Intro to Continuity
Related Videos
Related Practice


