5. Graphical Applications of Derivatives
Curve Sketching
Problem 4.3.107f
Textbook Question
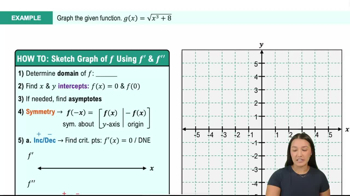
Interpreting the derivative The graph of f' on the interval [-3,2] is shown in the figure. <IMAGE>
f. Sketch one possible graph of f.
 Verified step by step guidance
1
Analyze the graph of the derivative f' to determine where it is positive, negative, and zero. This will help identify the intervals where the function f is increasing or decreasing.
Identify the critical points where f' changes sign (from positive to negative or vice versa) and where f' equals zero. These points correspond to local maxima, minima, or points of inflection in the graph of f.
Use the information about the intervals of increase and decrease to sketch the general shape of the graph of f. For example, where f' is positive, f should be increasing, and where f' is negative, f should be decreasing.
Consider the behavior of f at the endpoints of the interval [-3, 2]. If the graph of f' indicates any specific values at these points, use them to inform the starting and ending points of your sketch.
Finally, combine all the information gathered to create a smooth curve that reflects the behavior of f based on the analysis of f'. Ensure that the graph is continuous and follows the trends indicated by the derivative.
Recommended similar problem, with video answer:
Verified SolutionThis video solution was recommended by our tutors as helpful for the problem above
Video duration:
4mWas this helpful?

 11:41m
Watch next
Master Summary of Curve Sketching with a bite sized video explanation from Callie
Start learning