4. Applications of Derivatives
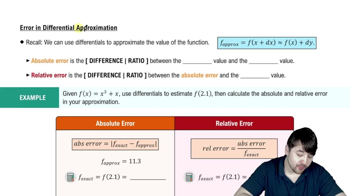
Differentials
Problem 4.8.33
Textbook Question
{Use of Tech} Tumor size In a study conducted at Dartmouth College, mice with a particular type of cancerous tumor were treated with the chemotherapy drug Cisplatin. If the volume of one of these tumors at the time of treatment is V₀, then the volume of the tumor t days after treatment is modeled by the function V(t) = V₀ (0.99e⁻⁰·¹²¹⁶ᵗ + 0.01e⁰·²³⁹ᵗ). (Source: Undergraduate Mathematics for the Life Sciences, MAA Notes No. 81, 2013)
Plot a graph of y = 0.99e⁻⁰·¹²¹⁶ᵗ + 0.01e⁰·²³⁹ᵗ, for 0 ≤ t ≤ 16, and describe the tumor size over time. Use Newton’s method to determine when the tumor decreases to half of its original size.
 Verified step by step guidance
1
Step 1: Understand the function V(t) = V₀ (0.99e⁻⁰·¹²¹⁶ᵗ + 0.01e⁰·²³⁹ᵗ). This function models the volume of the tumor over time, where V₀ is the initial volume, and t is the time in days. The function consists of two exponential terms that describe the change in tumor volume over time.
Step 2: To plot the graph of y = 0.99e⁻⁰·¹²¹⁶ᵗ + 0.01e⁰·²³⁹ᵗ for 0 ≤ t ≤ 16, evaluate the function at several points within this interval. This will help visualize how the tumor size changes over time. Note that the first term decreases over time due to the negative exponent, while the second term increases due to the positive exponent.
Step 3: Describe the behavior of the tumor size over time based on the graph. Initially, the tumor size decreases rapidly due to the dominant effect of the first term. Over time, the influence of the second term becomes more significant, potentially leading to an increase in tumor size.
Step 4: To find when the tumor decreases to half of its original size, set V(t) = 0.5V₀. This simplifies to solving 0.99e⁻⁰·¹²¹⁶ᵗ + 0.01e⁰·²³⁹ᵗ = 0.5. Use Newton's method to find the root of the equation f(t) = 0.99e⁻⁰·¹²¹⁶ᵗ + 0.01e⁰·²³⁹ᵗ - 0.5 = 0.
Step 5: Apply Newton's method, which involves iterating the formula tₙ₊₁ = tₙ - f(tₙ)/f'(tₙ), where f'(t) is the derivative of f(t). Start with an initial guess for t, and iterate until the change in t is sufficiently small. The derivative f'(t) can be calculated as f'(t) = -0.99 * 0.1216 * e⁻⁰·¹²¹⁶ᵗ + 0.01 * 0.239 * e⁰·²³⁹ᵗ.
Verified video answer for a similar problem:This video solution was recommended by our tutors as helpful for the problem above
Video duration:
7mWas this helpful?
Key Concepts
Here are the essential concepts you must grasp in order to answer the question correctly.
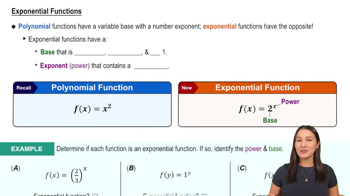
Exponential Functions
Exponential functions are mathematical expressions in the form f(t) = a * e^(kt), where 'e' is the base of natural logarithms, 'a' is a constant, and 'k' is a rate of growth or decay. In the context of tumor volume, the function V(t) = V₀ (0.99e⁻⁰·¹²¹⁶ᵗ + 0.01e⁰·²³⁹ᵗ) describes how the tumor volume changes over time, with different rates of decay represented by the coefficients of the exponential terms.
Recommended video:
 6:13
6:13Exponential Functions
Graphing Functions
Graphing functions involves plotting points on a coordinate system to visualize the relationship between variables. For the given function, plotting V(t) over the interval 0 ≤ t ≤ 16 allows us to observe how the tumor size changes over time, identifying trends such as growth or decay. This visual representation is crucial for understanding the dynamics of tumor response to treatment.
Recommended video:
 5:53
5:53Graph of Sine and Cosine Function
Newton's Method
Newton's Method is an iterative numerical technique used to find approximate solutions to equations, particularly useful for finding roots. In this context, it can be applied to determine when the tumor volume V(t) decreases to half of its original size, V₀/2. By iteratively refining guesses based on the function's slope, this method provides a practical approach to solving complex equations that may not have straightforward analytical solutions.
Recommended video:
 4:26
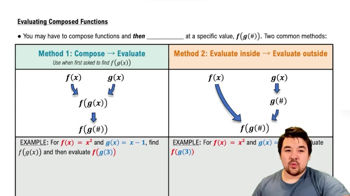
4:26Evaluating Composed Functions