42. Osmoregulation and Excretion
Osmoregulation and Excretion
Problem 16b
Textbook Question
Textbook QuestionFish and other aquatic organisms are exposed to many types of water pollutants, including metals such as aluminum. Although a low level of aluminum is found in unpolluted water, many lakes and streams have an increased level because of mining, sewage treatment, and accidental spills of toxic materials. Aluminum pollution can result in mass fish die-offs. Draw a graph similar to the one here showing how the results would be different if the experiment had been performed on marine bony fish in seawater. (Assume that the osmolarity of seawater is 1100 mOsm and the set point osmolarity of marine bony fishes is 290 mOsm.)
 Verified step by step guidance
1
Identify the key variables for the graph: osmolarity of the environment (seawater) and the internal osmolarity of marine bony fish.
Set the x-axis to represent the osmolarity of the seawater, which is constant at 1100 mOsm, and the y-axis to represent the internal osmolarity of the fish, which is set at 290 mOsm.
Plot a horizontal line on the graph at y = 290 mOsm to represent the constant internal osmolarity of the marine bony fish in response to the external osmolarity.
Indicate on the graph that the internal osmolarity remains constant despite the high external osmolarity, demonstrating osmoregulation in marine bony fish.
Label the graph appropriately, including titles for the x-axis and y-axis, and provide a legend if necessary to explain that the line represents the osmoregulatory ability of marine bony fish in maintaining internal osmolarity.
Recommended similar problem, with video answer:
Verified SolutionThis video solution was recommended by our tutors as helpful for the problem above
Video duration:
1mWas this helpful?
Key Concepts
Here are the essential concepts you must grasp in order to answer the question correctly.
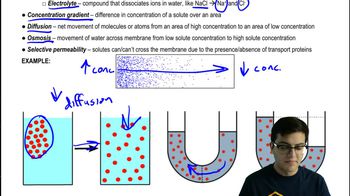
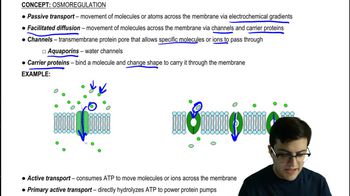
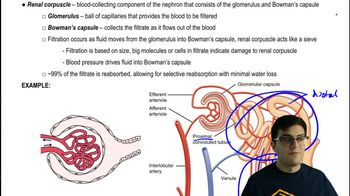
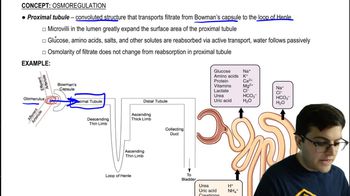
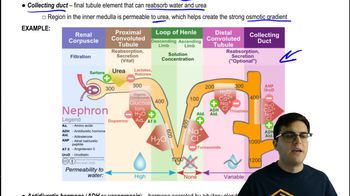
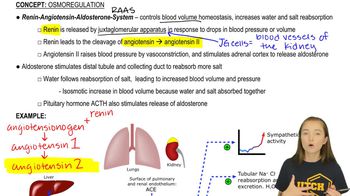
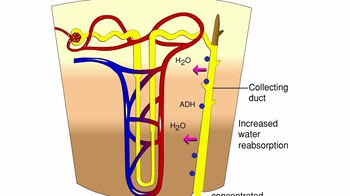
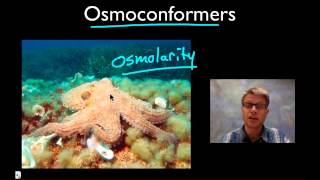
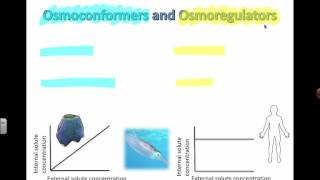
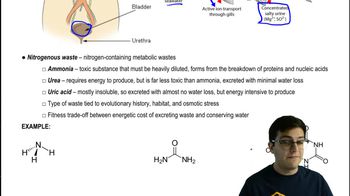
Osmoregulation
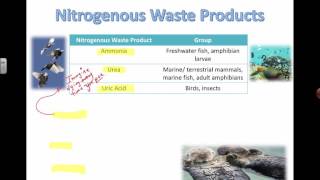
Osmoregulation is the process by which organisms maintain the balance of water and solutes in their bodies, crucial for survival in varying environments. Marine bony fish, for instance, have adapted to live in high osmolarity seawater (1100 mOsm) by actively excreting excess salts and retaining water to keep their internal osmolarity around 290 mOsm. Understanding this concept is essential for analyzing how pollutants like aluminum affect their physiological processes.
Recommended video:
Guided course
 07:16
07:16Osmoregulation and Nitrogenous Waste
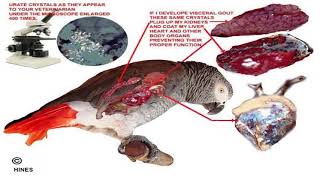
Toxicology of Heavy Metals
Heavy metals, such as aluminum, can be toxic to aquatic organisms, leading to physiological and ecological consequences. In fish, exposure to elevated aluminum levels can disrupt gill function, impair osmoregulation, and lead to increased mortality rates. Recognizing the toxic effects of heavy metals is vital for understanding the potential impacts of pollution on fish populations and aquatic ecosystems.
Recommended video:
Guided course
 02:25
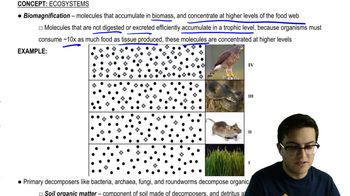
02:25Biomagnification and Decomposers
Graphical Data Representation
Graphical data representation is a method of visually displaying data to illustrate relationships and trends. In the context of the experiment, creating a graph to compare the effects of aluminum on freshwater versus marine bony fish allows for a clearer understanding of how different environments influence the toxicity and physiological responses of these organisms. This skill is essential for effectively communicating scientific findings.
Recommended video:
Guided course
 03:15
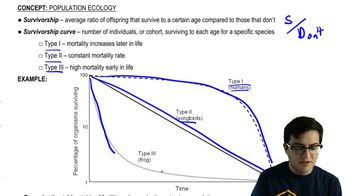
03:15Survivorship
 7:16m
7:16mWatch next
Master Osmoregulation and Nitrogenous Waste with a bite sized video explanation from Jason Amores Sumpter
Start learningRelated Videos
Related Practice