27. Protists
Eukaryotic Supergroups: Exploring Protist Diversity
Problem 6`
Textbook Question
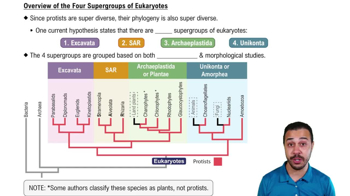
Based on the phylogenetic tree in Figure 28.2, which of the following statements is correct?
a. The most recent common ancestor of Excavata is older than that of SAR.
b. The most recent common ancestor of SAR is older than that of Unikonta.
c. The most basal (first to diverge) eukaryotic supergroup cannot be determined.
d. Excavata is the most basal eukaryotic supergroup.
 Verified step by step guidance
1
Understand the concept of a phylogenetic tree: A phylogenetic tree is a diagram that represents evolutionary relationships among various biological species based upon similarities and differences in their physical or genetic characteristics.
Identify the key terms: 'Most recent common ancestor' refers to the last shared ancestor between two groups. 'Basal' refers to the earliest diverging lineage in a phylogenetic tree.
Examine the phylogenetic tree in Figure 28.2: Look for the branching points that indicate common ancestors and note the order of divergence among the eukaryotic supergroups.
Compare the branching points: Determine which supergroup has the oldest common ancestor by comparing the positions of the branching points for Excavata, SAR, and Unikonta.
Assess the basal lineage: Evaluate the tree to see if there is a clear indication of which eukaryotic supergroup diverged first, or if the tree does not provide enough information to determine the most basal group.
Verified video answer for a similar problem:This video solution was recommended by our tutors as helpful for the problem above
Video duration:
3mWas this helpful?
Key Concepts
Here are the essential concepts you must grasp in order to answer the question correctly.
Phylogenetic Tree
A phylogenetic tree is a diagram that represents evolutionary relationships among various biological species based on similarities and differences in their physical or genetic characteristics. It shows how species are related through common ancestors, with branches indicating divergence points. Understanding the tree's structure is crucial for interpreting evolutionary timelines and ancestral connections.
Recommended video:

 04:13
04:13Building Phylogenetic Trees Example 2
Eukaryotic Supergroups
Eukaryotic supergroups are major classifications within the domain Eukarya, which includes organisms with complex cells containing a nucleus. The main supergroups are Excavata, SAR (Stramenopiles, Alveolates, and Rhizaria), Archaeplastida, and Unikonta. Each supergroup represents a distinct lineage, and understanding their evolutionary relationships helps in determining the order of divergence among them.
Recommended video:
Guided course
 03:01
03:01Overview of the Four Supergroups of Eukaryotes
Most Recent Common Ancestor
The most recent common ancestor (MRCA) refers to the last shared ancestor between two or more species or groups before they diverged into separate lineages. In phylogenetic analysis, identifying the MRCA helps in understanding the evolutionary timeline and the relative age of different groups. It is a key concept for determining which group diverged first or which ancestor is older.
Recommended video:
 06:39
06:39Common Misconceptions
 3:01m
3:01mWatch next
Master Overview of the Four Supergroups of Eukaryotes with a bite sized video explanation from Jason
Start learningRelated Videos
Related Practice