48. Ecology
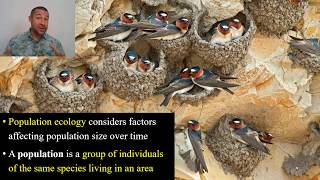
Introduction to Ecology
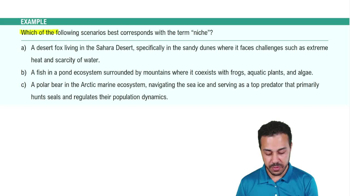
Problem 15b
Textbook Question
The red lionfish, Pterois volitans, has beautiful red stripes, streaming fins, and a fearless disposition, and it is deadly. Native to the Pacific Ocean, the red lionfish was first discovered on coral reefs in the Bahamas in 1985. The species has spread to over 3 million square kilometers of the western Atlantic and Gulf of Mexico. Lionfish have a voracious appetite for native fish, are armed with venomous spines, and have no natural predators in their new range. Biologists are scrambling to study the reproductive biology of lionfish to inform management decisions. For example, Alexander Fogg and colleagues studied lionfish females in the northern Gulf of Mexico and estimated that an average female could produce 2,332,490 eggs per year. What time of year is reproductive rate the highest? To answer this question, the researchers collected an average of 200 lionfish each month and measured ovary size relative to body size, an indicator of reproductive capacity. Describe the take-home message of the graph. How do the error bars affect your confidence in this message?
 Verified step by step guidance
1
Step 1: Start by understanding the problem. The problem is asking about the reproductive biology of the red lionfish, specifically when their reproductive rate is the highest. The researchers have collected data by measuring the ovary size relative to body size, which is an indicator of reproductive capacity.
Step 2: To answer the question about the time of year when the reproductive rate is the highest, you would need to look at the graph provided by the researchers. Unfortunately, the problem does not provide the graph. In a real scenario, you would look for the time of year when the ovary size relative to body size is the highest on the graph.
Step 3: The take-home message of the graph would be the overall trend or pattern that the data shows. This could be something like 'the reproductive rate of lionfish is highest in the summer months' or 'the reproductive rate of lionfish does not vary significantly throughout the year'. Again, without the actual graph, we can't determine the exact take-home message.
Step 4: Error bars on a graph typically represent the variability or uncertainty in the data. If the error bars are small, it means the data is very consistent and you can be more confident in the take-home message. If the error bars are large, it means there is a lot of variability in the data, which could make the take-home message less certain.
Step 5: In conclusion, to answer this question, you would need to interpret the graph provided by the researchers, looking for the time of year when the ovary size relative to body size is the highest. The take-home message would be the overall trend shown by the data, and the size of the error bars would affect your confidence in this message.
Verified video answer for a similar problem:This video solution was recommended by our tutors as helpful for the problem above
Video duration:
1mWas this helpful?
Key Concepts
Here are the essential concepts you must grasp in order to answer the question correctly.
Reproductive Biology
Reproductive biology studies the mechanisms and processes involved in the reproduction of organisms. In the context of the red lionfish, understanding reproductive biology includes examining factors such as ovary size, egg production rates, and seasonal breeding patterns. This knowledge is crucial for assessing population dynamics and informing management strategies to control invasive species.
Recommended video:
Guided course

 03:12
03:12Fungi Reproduction - 3
Statistical Analysis and Error Bars
Statistical analysis involves interpreting data to draw conclusions about a population based on sample observations. Error bars represent the variability or uncertainty in the data, indicating the range within which the true value likely falls. In the context of the lionfish study, error bars can affect confidence in the reproductive rate findings, as larger error bars suggest greater uncertainty in the estimates.
Recommended video:
Guided course
 00:43
00:43Population Demography
Invasive Species Impact
Invasive species, like the red lionfish, can significantly disrupt local ecosystems by outcompeting native species for resources. Understanding their reproductive rates and population growth is essential for predicting their impact on biodiversity and ecosystem health. Effective management strategies often rely on this information to mitigate the negative effects of invasives on native fish populations.
Recommended video:
Guided course
 03:35
03:35Geographic Impact on Communities
 2:54m
2:54mWatch next
Master What is Ecology? with a bite sized video explanation from Jason Amores Sumpter
Start learningRelated Videos
Related Practice