50. Population Ecology
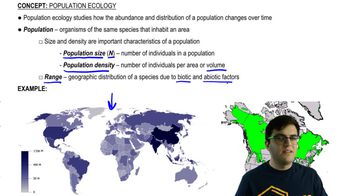
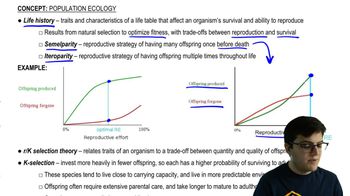
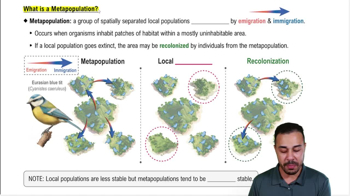
Introduction to Population Ecology
Problem 10c
Textbook Question
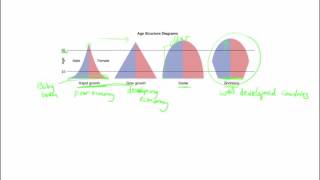
Make a rough sketch of the age distribution in a developing versus a developed country, and explain why the shapes of the diagrams are different. How is AIDS, which is a sexually transmitted disease, likely affecting the age distribution in countries hard hit by the epidemic?
 Verified step by step guidance
1
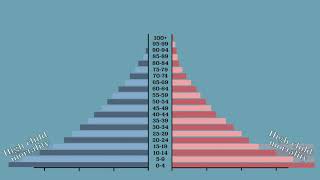
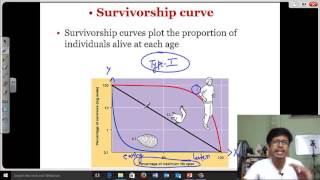
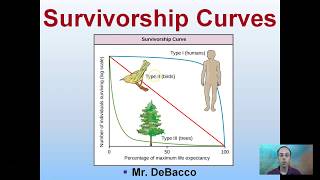
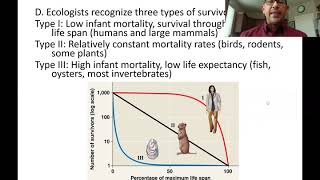
Identify the typical age distribution shapes for developing and developed countries. Developing countries usually have a broad base pyramid shape indicating a high birth rate and a larger proportion of young people. Developed countries typically have a more rectangular or even inverted pyramid shape, indicating lower birth rates and a higher proportion of older individuals.
Examine the factors influencing these shapes. In developing countries, higher fertility rates and lower life expectancy shape the pyramid, while in developed countries, lower fertility rates and higher life expectancy lead to a more even distribution or a top-heavy pyramid.
Sketch the age distribution diagrams based on these characteristics. For a developing country, draw a wide base that narrows sharply with increasing age. For a developed country, draw a more uniformly wide shape across younger age groups that narrows slightly or remains stable into older age groups.
Discuss how AIDS affects age distribution in countries with high incidence rates. AIDS disproportionately affects young to middle-aged adults, leading to a higher mortality rate in these age groups. This creates gaps or indentations in the age distribution pyramid around the affected age groups, altering the typical shape.
Reflect on the broader implications of these differences in age distribution. Consider how they affect economic productivity, dependency ratios, and social services needs in both developing and developed countries, especially with the impact of diseases like AIDS.
Recommended similar problem, with video answer:
Verified SolutionThis video solution was recommended by our tutors as helpful for the problem above
Video duration:
2mWas this helpful?
Key Concepts
Here are the essential concepts you must grasp in order to answer the question correctly.
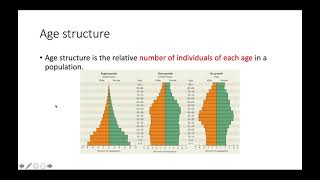
Age Distribution
Age distribution refers to the proportion of individuals of different ages within a population. It is typically represented in a population pyramid, where the shape can indicate demographic trends. In developing countries, the pyramid often has a broad base, indicating a high birth rate and a youthful population, while developed countries tend to have a more rectangular shape, reflecting lower birth rates and an aging population.
Recommended video:
Guided course
 01:12
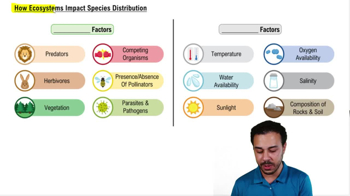
01:12How Ecosystems Impact Species Distribution
Impact of AIDS on Demographics
AIDS significantly impacts the age distribution in countries heavily affected by the epidemic, particularly among young adults. The disease primarily affects individuals in their reproductive years, leading to a decrease in the working-age population and a skewed age distribution. This results in a higher proportion of younger and older individuals, as the middle age group is disproportionately affected by mortality due to AIDS.
Recommended video:
Guided course
 00:43
00:43Population Demography
Developed vs. Developing Countries
Developed countries typically have higher levels of income, education, and healthcare, leading to lower birth and death rates. In contrast, developing countries often experience higher fertility rates and lower life expectancy due to limited access to healthcare and education. These differences contribute to distinct age distribution patterns, with developed nations showing more balanced age structures and developing nations exhibiting youthful populations with rapid growth.
Recommended video:
Guided course
 06:02
06:02Embryonic Plant Development
 1:17m
1:17mWatch next
Master Population Ecology with a bite sized video explanation from Jason Amores Sumpter
Start learningRelated Videos
Related Practice