Table of contents
- 1. Introduction to Biology2h 41m
- 2. Chemistry3h 37m
- 3. Water1h 26m
- 4. Biomolecules2h 23m
- 5. Cell Components2h 26m
- 6. The Membrane2h 31m
- 7. Energy and Metabolism2h 0m
- 8. Respiration2h 40m
- 9. Photosynthesis2h 49m
- 10. Cell Signaling59m
- 11. Cell Division2h 47m
- 12. Meiosis2h 0m
- 13. Mendelian Genetics4h 44m
- Introduction to Mendel's Experiments7m
- Genotype vs. Phenotype17m
- Punnett Squares13m
- Mendel's Experiments26m
- Mendel's Laws18m
- Monohybrid Crosses19m
- Test Crosses14m
- Dihybrid Crosses20m
- Punnett Square Probability26m
- Incomplete Dominance vs. Codominance20m
- Epistasis7m
- Non-Mendelian Genetics12m
- Pedigrees6m
- Autosomal Inheritance21m
- Sex-Linked Inheritance43m
- X-Inactivation9m
- 14. DNA Synthesis2h 27m
- 15. Gene Expression3h 20m
- 16. Regulation of Expression3h 31m
- Introduction to Regulation of Gene Expression13m
- Prokaryotic Gene Regulation via Operons27m
- The Lac Operon21m
- Glucose's Impact on Lac Operon25m
- The Trp Operon20m
- Review of the Lac Operon & Trp Operon11m
- Introduction to Eukaryotic Gene Regulation9m
- Eukaryotic Chromatin Modifications16m
- Eukaryotic Transcriptional Control22m
- Eukaryotic Post-Transcriptional Regulation28m
- Eukaryotic Post-Translational Regulation13m
- 17. Viruses37m
- 18. Biotechnology2h 58m
- 19. Genomics17m
- 20. Development1h 5m
- 21. Evolution3h 1m
- 22. Evolution of Populations3h 53m
- 23. Speciation1h 37m
- 24. History of Life on Earth2h 6m
- 25. Phylogeny2h 31m
- 26. Prokaryotes4h 59m
- 27. Protists1h 12m
- 28. Plants1h 22m
- 29. Fungi36m
- 30. Overview of Animals34m
- 31. Invertebrates56m
- 32. Vertebrates50m
- 33. Plant Anatomy1h 3m
- 34. Vascular Plant Transport1h 2m
- 35. Soil37m
- 36. Plant Reproduction47m
- 37. Plant Sensation and Response1h 9m
- 38. Animal Form and Function1h 19m
- 39. Digestive System1h 10m
- 40. Circulatory System1h 49m
- 41. Immune System1h 12m
- 42. Osmoregulation and Excretion50m
- 43. Endocrine System1h 4m
- 44. Animal Reproduction1h 2m
- 45. Nervous System1h 55m
- 46. Sensory Systems46m
- 47. Muscle Systems23m
- 48. Ecology3h 11m
- Introduction to Ecology20m
- Biogeography14m
- Earth's Climate Patterns50m
- Introduction to Terrestrial Biomes10m
- Terrestrial Biomes: Near Equator13m
- Terrestrial Biomes: Temperate Regions10m
- Terrestrial Biomes: Northern Regions15m
- Introduction to Aquatic Biomes27m
- Freshwater Aquatic Biomes14m
- Marine Aquatic Biomes13m
- 49. Animal Behavior28m
- 50. Population Ecology3h 41m
- Introduction to Population Ecology28m
- Population Sampling Methods23m
- Life History12m
- Population Demography17m
- Factors Limiting Population Growth14m
- Introduction to Population Growth Models22m
- Linear Population Growth6m
- Exponential Population Growth29m
- Logistic Population Growth32m
- r/K Selection10m
- The Human Population22m
- 51. Community Ecology2h 46m
- Introduction to Community Ecology2m
- Introduction to Community Interactions9m
- Community Interactions: Competition (-/-)38m
- Community Interactions: Exploitation (+/-)23m
- Community Interactions: Mutualism (+/+) & Commensalism (+/0)9m
- Community Structure35m
- Community Dynamics26m
- Geographic Impact on Communities21m
- 52. Ecosystems2h 36m
- 53. Conservation Biology24m
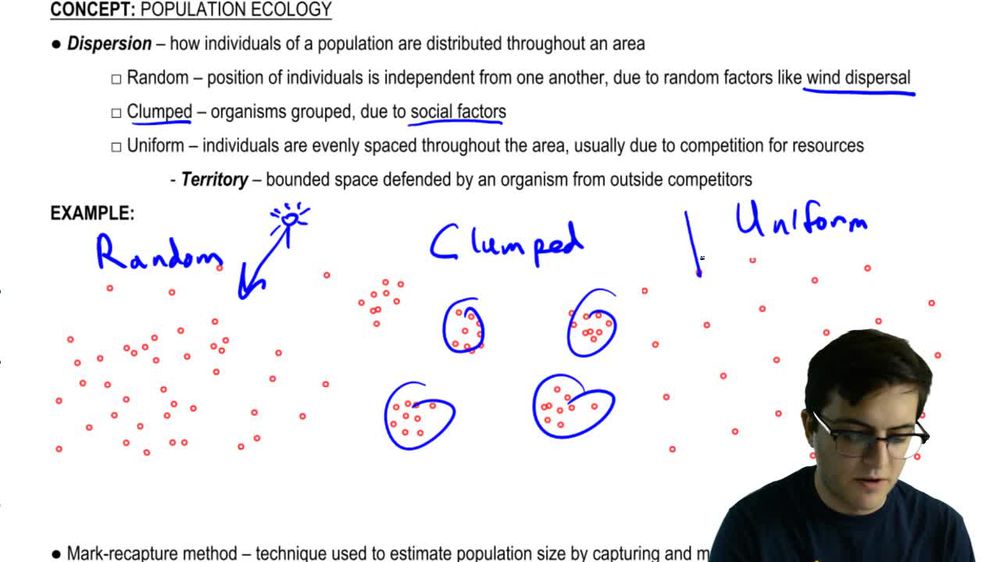
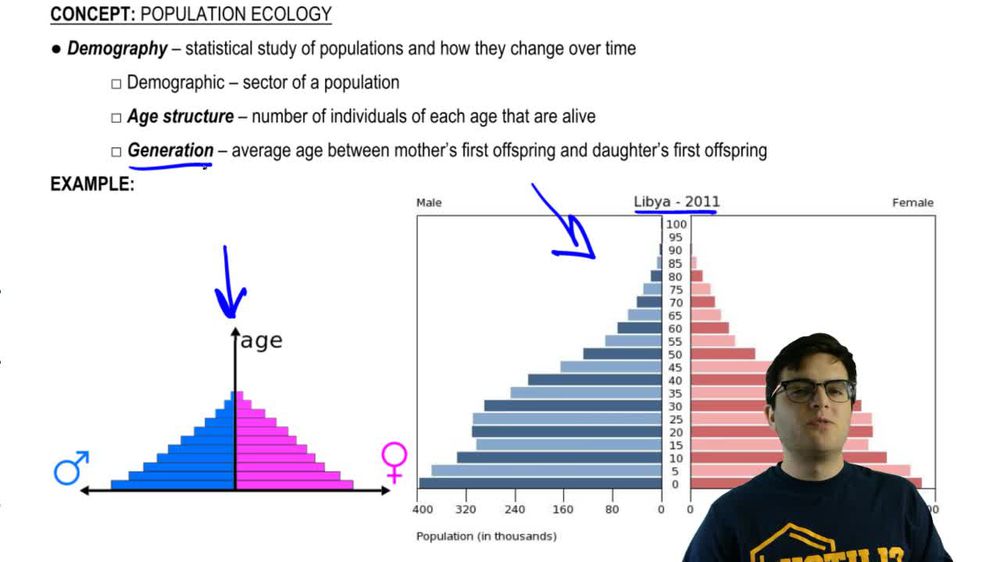
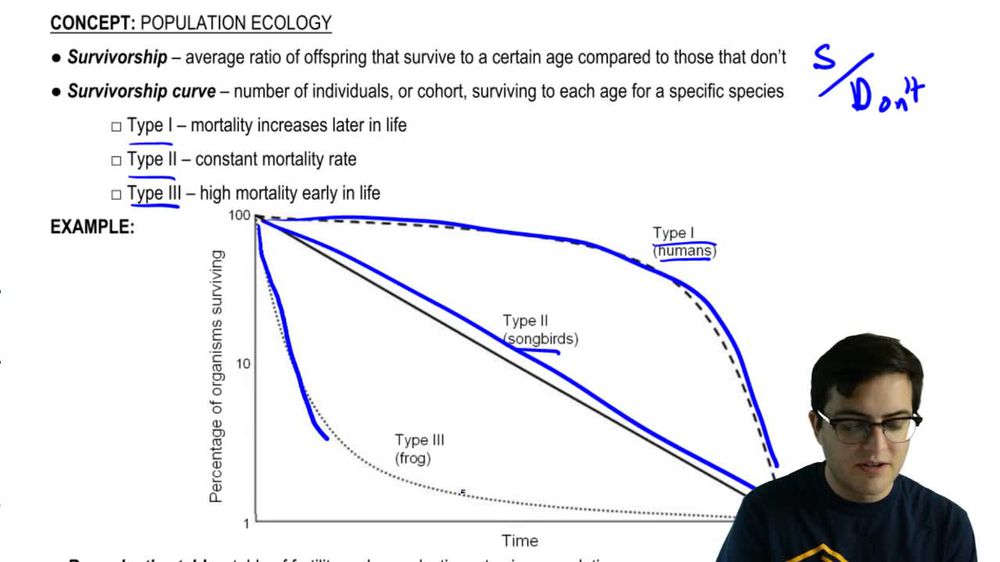
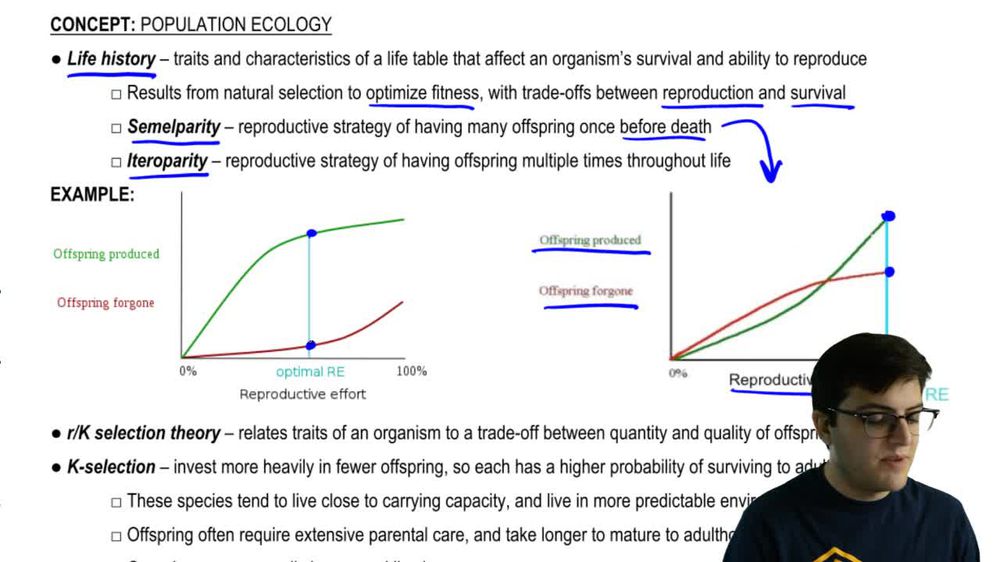
50. Population Ecology
Introduction to Population Ecology


Population Growth
Jason Amores Sumpter
Video duration:
5mPlay a video:
Related Videos
Related Practice
 04:07
04:07