53. Conservation Biology
Conservation Biology
Problem 6e
Textbook Question
Biologists claim that the all-taxa survey now under way at the Great Smoky Mountains National Park in the United States will improve their ability to estimate the total number of species living today. Discuss the benefits and limitations that this data set will provide in understanding the extent of global biodiversity.
 Verified step by step guidance
1
Identify the purpose of the all-taxa survey: The all-taxa survey aims to catalog every species within the Great Smoky Mountains National Park. Understanding the purpose helps in assessing how the data might influence broader biodiversity estimates.
Discuss the benefits of the survey: The survey provides a comprehensive inventory of species in a specific area, which can serve as a reference point for biodiversity. It helps in identifying new species, understanding species distribution, and providing data for conservation efforts.
Consider the representativeness of the data: While the survey provides detailed local biodiversity information, one limitation is its geographic specificity. The data from one region (even if thoroughly collected) may not be fully representative of global biodiversity patterns.
Evaluate the impact on global biodiversity estimates: The survey can improve models and methods for estimating global biodiversity by providing high-quality, localized data. However, extrapolating this data to a global scale requires careful consideration of biogeographic and ecological differences.
Analyze the implications for conservation and policy: The detailed data can inform more targeted conservation strategies and policies at both local and global levels. However, the focus on one location might divert attention or resources from other areas that are less studied but equally important for global biodiversity.
Recommended similar problem, with video answer:
Verified SolutionThis video solution was recommended by our tutors as helpful for the problem above
Video duration:
1mWas this helpful?
Key Concepts
Here are the essential concepts you must grasp in order to answer the question correctly.
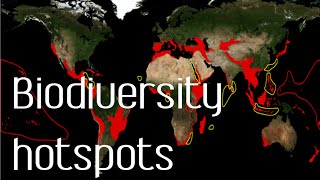
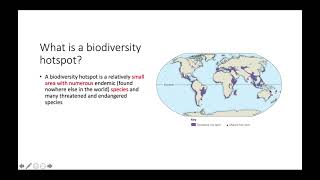
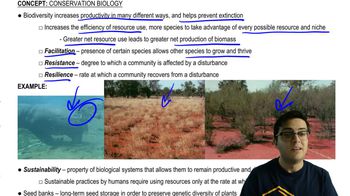
Biodiversity
Biodiversity refers to the variety of life forms within a given ecosystem, region, or on the entire planet. It encompasses the diversity of species, genetic variations, and the ecosystems they inhabit. Understanding biodiversity is crucial for assessing the health of ecosystems and the services they provide, such as food, clean water, and climate regulation.
Recommended video:
Guided course
 05:06
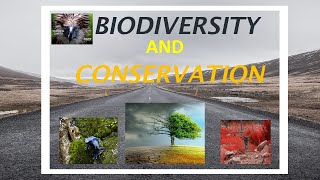
05:06Biodiversity and Sustainability
All-Taxa Survey
An all-taxa survey is a comprehensive approach to cataloging all species within a specific area, regardless of their taxonomic group. This method aims to provide a complete inventory of biodiversity, which can help identify species richness, distribution, and ecological interactions. Such surveys are essential for conservation efforts and understanding ecological dynamics.
Recommended video:
 11:28
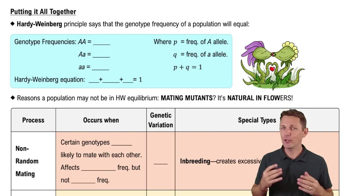
11:28Putting it All Together
Data Limitations
While data from all-taxa surveys can significantly enhance our understanding of biodiversity, there are inherent limitations. These include potential biases in species detection, incomplete sampling, and the challenge of identifying cryptic species. Additionally, the data may not fully represent temporal changes in biodiversity, making it essential to interpret findings with caution.
Recommended video:
Guided course
 00:51
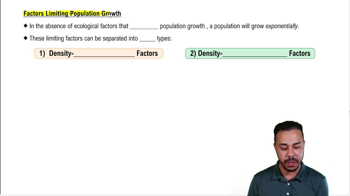
00:51Factors Limiting Population Growth
 3:56m
3:56mWatch next
Master Conservation Biology and Biodiversity with a bite sized video explanation from Jason Amores Sumpter
Start learningRelated Videos
Related Practice