50. Population Ecology
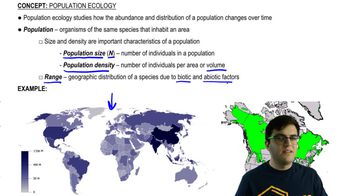
Introduction to Population Ecology
Problem 14b
Textbook Question
Textbook QuestionBurmese pythons (Python molurus bivittatus) are constricting snakes that can reach enormous sizes (up to 7 meters in length). They are native to Southeast Asia but were released into southern Florida from the pet trade. Many other snakes occur naturally in this area. Are the introduced pythons a problem? A life table would help researchers make predictions about python population growth. If you were to track a cohort of pythons over time to construct a detailed life table, what kind of data would you want to collect?
 Verified step by step guidance
1
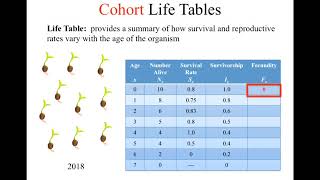
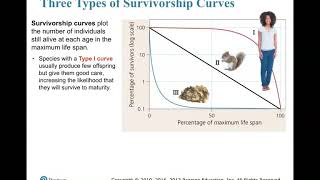
1. Age-specific survival rate: This is the proportion of individuals that survive from birth to any given age. It's usually denoted as 'lx' in life tables. This data can be collected by tracking the number of individuals from the cohort that are still alive at each age.
2. Age-specific fecundity: This is the average number of offspring produced by a female at a particular age. It's usually denoted as 'mx' in life tables. This data can be collected by observing the number of offspring produced by females in the cohort at each age.
3. Age at first reproduction: This is the age at which an individual first reproduces. This data can be collected by observing when individuals in the cohort first produce offspring.
4. Mortality causes: Understanding the causes of death can help predict future survival rates. This data can be collected by observing and recording the causes of death for individuals in the cohort.
5. Population size: This is the total number of individuals in the cohort at each age. This data can be collected by counting the number of individuals in the cohort at each age.
Recommended similar problem, with video answer:
Verified SolutionThis video solution was recommended by our tutors as helpful for the problem above
Video duration:
1mWas this helpful?
Key Concepts
Here are the essential concepts you must grasp in order to answer the question correctly.
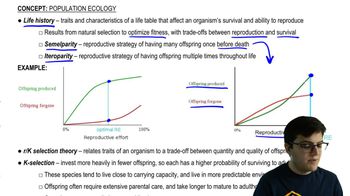
Life Table
A life table is a demographic tool used to summarize the survival and reproductive rates of a population at various ages. It provides essential data for understanding population dynamics, including birth rates, death rates, and life expectancy. By tracking a cohort over time, researchers can predict future population growth and assess the impact of environmental factors on survival.
Recommended video:
Guided course

 03:49
03:49Life Tables
Cohort Tracking
Cohort tracking involves monitoring a specific group of individuals from the same age or developmental stage over time. This method allows researchers to gather data on survival rates, reproduction, and mortality patterns within that group. For Burmese pythons, tracking a cohort would help in understanding their growth, behavior, and ecological impact in a new environment.
Recommended video:
Guided course
03:49Life Tables
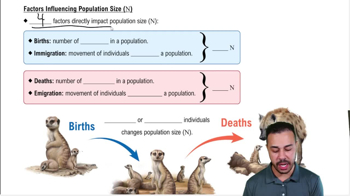
Population Dynamics
Population dynamics refers to the study of how populations change over time due to births, deaths, immigration, and emigration. It encompasses various factors that influence population size and structure, such as resource availability and predation. Understanding these dynamics is crucial for assessing the potential ecological consequences of introduced species like Burmese pythons in Florida.
Recommended video:
Guided course
 03:01
03:01Community Dynamics Example 1
 1:17m
1:17mWatch next
Master Population Ecology with a bite sized video explanation from Jason Amores Sumpter
Start learningRelated Videos
Related Practice