In this video, we're going to talk a lot more about the initial velocities of enzyme catalyzed reactions. As we already know from our previous lesson videos, when biochemists study enzyme catalyzed reactions in a lab, they mainly focus on the initial rates of the enzyme catalyzed reactions. A lot of this has to do with the fact that enzyme catalyzed reaction rates naturally decrease over time. The reason these enzyme catalyzed reactions proceed over time has to do with the fact that the substrate concentration is also decreasing over time. Remember, higher substrate concentration is correlated with a higher reaction rate, and so a lower substrate concentration is correlated with a lower reaction rate. The reason that the substrate concentration is decreasing over time is because the substrate is literally being converted into products over time. Additionally, the reverse reaction from the product backwards to reform the substrate becomes more significant as a concentration accumulates over time. If this reverse reaction becomes more of a factor over time, it's going to make it more difficult for a biochemist to measure the forward reaction rate if the reverse reaction is occurring at a significant rate.
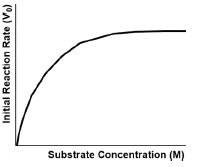
The initial velocity, abbreviated as \( v_0 \), is the reaction velocity at the very beginning of a reaction when the substrate concentration is at its highest and the reverse reaction from product back into substrate is essentially negligible since there is really zero or no product at the very beginning of a reaction. Essentially, what we're saying here is that the initial velocity, \( v_0 \), is really the best chance that a reaction has at approaching its maximum velocity, \( v_{\text{max}} \), which we're going to talk a lot more about in another video later in our course. We will be able to talk about this idea of approaching its maximum velocity in more detail in that video. But just to give you a quick preview, enzymes are not able to attain their maximum velocities; they are only able to approach their maximum velocities. We'll talk more about that idea in a different topic when we talk about maximum reaction velocity.
But for now, let's take a look at this example down below and in this example we actually have two different graphs. We have this graph over here on the left and then we have this graph over here on the right. Now, looking at the graph on the left first, notice that we have the product concentration on the y-axis and the time as the reaction progresses on the x-axis, and we've seen this graph plenty of times in our previous lesson videos. We know that the curve looks just like this, and ultimately we know that the product concentration stops increasing over time, and that's because at the equilibrium, we know that the product concentration has gotten to a point where equilibrium has been reached. At equilibrium, we know that the rate of the forward reaction is exactly equal to the rate of the reverse reaction. However, if we look at the very beginning of the reaction, where the time is really close to zero, and we know that if we take the slope of a line that's tangent to any point on this curve, we can get the reaction rate. If we take the slope of the line early on in this curve, we can get the initial reaction rate because we have the initial slope. This initial slope of our curve is going to give us the initial reaction rate, and the reaction rate is always going to be the change in product concentration over the change in time.
Looking at this graph over here on the right, notice the instructions are telling us to draw in the curve for the second graph below. So there is no curve and we need to draw the curve in. Notice that the y-axis is actually changing. It's very important for us to note what these y-axes actually are. In this y-axis what we have is the reaction rates, and on this one, we have the product concentration. Over time, as we already discussed above, we know that reaction rates naturally decrease over time. So we expect the reaction rate here is actually going to decrease over time. It's going to start really high but then ultimately, it's going to decrease as time progresses. This curve should look like a decreasing slope over time.
What this means is that the initial reaction rate, \( v_0 \), is the fastest possible rate. The initial reaction rate occurs where we have the initial time, and the initial time is where the time is approximately equal to zero, really early on. This is where we can expect to find our initial reaction rate really early on in the reaction. So this is our \( v_0 \) and that’s why we expect the initial reaction rate to be the fastest rate. It's important to note that all of the enzyme kinetics calculations we're going to see in our course moving forward from this point are going to assume that the reaction velocity measured is the initial velocity, \( v_0 \). Essentially, because the initial velocity allows us to approach the maximum velocity, it makes it easier to compare reaction velocities across different enzyme catalyzed reactions when we’re specifically focusing on the initial velocity. If we weren't comparing the initial velocities, it would be very difficult to compare reaction velocities across different enzyme catalyzed reactions.
This concludes our lesson on initial reaction velocity, and we’ll be able to apply all of these concepts that we’ve learned here as we move along in our course. I'll see you guys in our next lesson video where we'll be able to talk about the enzyme kinetics plots.


