An electrocardiogram (ECG or EKG) is a vital tool used to measure and record the electrical activity of the heart. Understanding the distinction between the electrocardiograph, which is the machine that captures this data, and the electrocardiogram, which is the actual recording, is essential. The electrocardiogram provides insights into the heart's electrical conduction system, particularly the depolarization and repolarization phases of the heart's chambers.
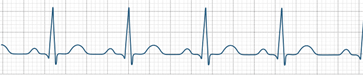
The ECG primarily reflects the electrical activity associated with the heart's contractile cells. When analyzing an ECG, four key events are monitored: the depolarization and repolarization of the atria, and the depolarization and repolarization of the ventricles. The P wave represents the depolarization of the atria, initiated by the sinoatrial (SA) node. Following this, the QRS complex indicates the depolarization of the ventricles, which is significantly larger due to the greater mass of the ventricular muscle compared to the atria.
During the QRS complex, the atria are simultaneously repolarizing, but this activity is not visible on the ECG due to the overwhelming electrical activity of the ventricles. The T wave follows, representing the repolarization of the ventricles. Understanding these components is crucial for interpreting the ECG accurately.
In addition to the waves, intervals and segments are important for analysis. An interval, such as the PR interval, measures the time from the beginning of one wave to the beginning of another, while a segment, like the ST segment, refers to the flat line between two waves. The PR interval includes the P wave and extends to the start of the QRS complex, indicating the time taken for the electrical signal to travel from the atria to the ventricles, which is delayed by the atrioventricular (AV) node. The ST segment represents the plateau phase of the ventricles during contraction.
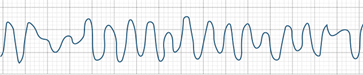
While a normal ECG provides a baseline for heart function, deviations from this pattern can indicate underlying issues within the heart's electrical conduction system. Familiarity with the normal ECG pattern and its components allows for better identification of potential abnormalities, which is crucial for diagnosing cardiac conditions.