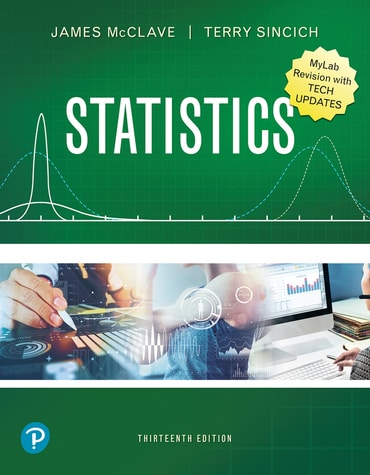
Statistics, Updated Edition, 13th edition

Published by Pearson (July 15, 2020) © 2021

  • James T McClave University of Florida
  • Terry T Sincich University of South Florida

eTextbook on Pearson+

ISBN-13: 9780136881285 (2020 update)

eTextbook rental includes

  • Instant access to eTextbook
  • Search, highlight, and notes
  • Create flashcards
Products list

Details

  • A print text you can rent
  • Fulfilled by eCampus.com
  • Option to keep after rental expires

Purchasing Instructions

This form contains two groups of radio buttons, one for Exam Pack purchasing options, and one for standard purchasing options. Only one option can be chosen for purchase. Any option that is selected will deselect any previously selected purchase option.

Online exclusive offer

MyLab Statistics with Pearson eText for Statistics, Updated Edition + subscription to Study & Exam Prep

MyLab Statistics with Pearson eText for Statistics, Updated Edition

Platform features

  • Pearson+ eTextbook with study tools
  • Tailored feedback on assignments
  • Interactive course-specific content
  • Real-time analytics and insights
Requires a Course ID, a link from your instructor or an LMS link (Blackboard™, Canvas™, Moodle or D2L®)

Statistics, 13th Edition is a contemporary classic, a trusted and comprehensive introduction to statistics that emphasizes inference and integrates real data throughout. McClave and Sincich emphasize the development of statistical thinking, the assessment of credibility, and value of the inferences made from data. They provide ample support when you are learning to solve problems and when you are studying and reviewing the material. Case studies, applications and biographies keep you motivated and demonstrate the relevance of statistics. Ideal for 1- or 2-semester courses, Statistics assumes a mathematical background of basic algebra. For more advanced courses, it offers optional footnotes about calculus and the underlying theory. The print book has been reprinted with new and updated statistical software screenshots. 

1. Statistics, Data, and Statistical Thinking

  • 1.1 The Science of Statistics
  • 1.2 Types of Statistical Applications
  • 1.3 Fundamental Elements of Statistics
  • 1.4 Types of Data
  • 1.5 Collecting Data: Sampling and Related Issues
  • 1.6 The Role of Statistics in Critical Thinking and Ethics

2. Methods for Describing Sets of Data

  • 2.1 Describing Qualitative Data
  • 2.2 Graphical Methods for Describing Quantitative Data
  • 2.3 Numerical Measures of Central Tendency
  • 2.4 Numerical Measures of Variability
  • 2.5 Using the Mean and Standard Deviation to Describe Data
  • 2.6 Numerical Measures of Relative Standing
  • 2.7 Methods for Detecting Outliers: Box Plots and z-Scores
  • 2.8 Graphing Bivariate Relationships (Optional)
  • 2.9 Distorting the Truth with Descriptive Statistics

3. Probability

  • 3.1 Events, Sample Spaces, and Probability
  • 3.2 Unions and Intersections
  • 3.3 Complementary Events
  • 3.4 The Additive Rule and Mutually Exclusive Events
  • 3.5 Conditional Probability
  • 3.6 The Multiplicative Rule and Independent Events
  • 3.7 Some Additional Counting Rules (Optional)
  • 3.8 Bayes's Rule (Optional)

4. Discrete Random Variables

  • 4.1 Two Types of Random Variables
  • 4.2 Probability Distributions for Discrete Random Variables
  • 4.3 Expected Values of Discrete Random Variables
  • 4.4 The Binomial Random Variable
  • 4.5 The Poisson Random Variable (Optional)
  • 4.6 The Hypergeometric Random Variable (Optional)

5. Continuous Random Variables

  • 5.1 Continuous Probability Distributions
  • 5.2 The Uniform Distribution
  • 5.3 The Normal Distribution
  • 5.4 Descriptive Methods for Assessing Normality
  • 5.5 Approximating a Binomial Distribution with a Normal Distribution (Optional)
  • 5.6 The Exponential Distribution (Optional)

6. Sampling Distributions

  • 6.1 The Concept of a Sampling Distribution
  • 6.2 Properties of Sampling Distributions: Unbiasedness and Minimum Variance
  • 6.3 The Sampling Distribution of (x-bar) and the Central Limit Theorem
  • 6.4 The Sampling Distribution of the Sample Proportion

7. Inferences Based on a Single Sample: Estimation with Confidence Intervals

  • 7.1 Identifying and Estimating the Target Parameter
  • 7.2 Confidence Interval for a Population Mean: Normal (z) Statistic
  • 7.3 Confidence Interval for a Population Mean: Student's t-Statistic
  • 7.4 Large-Sample Confidence Interval for a Population Proportion
  • 7.5 Determining the Sample Size
  • 7.6 Confidence Interval for a Population Variance (Optional)

8. Inferences Based on a Single Sample: Tests of Hypothesis

  • 8.1 The Elements of a Test of Hypothesis
  • 8.2 Formulating Hypotheses and Setting Up the Rejection Region
  • 8.3 Observed Significance Levels: p-Values
  • 8.4 Test of Hypothesis about a Population Mean: Normal (z) Statistic
  • 8.5 Test of Hypothesis about a Population Mean: Student's t-Statistic
  • 8.6 Large-Sample Test of Hypothesis about a Population Proportion
  • 8.7 Calculating Type II Error Probabilities: More about β (Optional)
  • 8.8 Test of Hypothesis about a Population Variance (Optional)

9. Inferences Based on Two Samples: Confidence Intervals and Tests of Hypotheses

  • 9.1 Identifying the Target Parameter
  • 9.2 Comparing Two Population Means: Independent Sampling
  • 9.3 Comparing Two Population Means: Paired Difference Experiments
  • 9.4 Comparing Two Population Proportions: Independent Sampling
  • 9.5 Determining the Sample Size
  • 9.6 Comparing Two Population Variances: Independent Sampling (Optional)

10. Analysis of Variance: Comparing More than Two Means

  • 10.1 Elements of a Designed Study
  • 10.2 The Completely Randomized Design: Single Factor
  • 10.3 Multiple Comparisons of Means
  • 10.4 The Randomized Block Design
  • 10.5 Factorial Experiments: Two Factors

11. Simple Linear Regression

  • 11.1 Probabilistic Models
  • 11.2 Fitting the Model: The Least Squares Approach
  • 11.3 Model Assumptions
  • 11.4 Assessing the Utility of the Model: Making Inferences about the Slope β1
  • 11.5 The Coefficients of Correlation and Determination
  • 11.6 Using the Model for Estimation and Prediction
  • 11.7 A Complete Example

12. Multiple Regression and Model Building

  • 12.1 Multiple-Regression Models
  • PART I: First-Order Models with Quantitative Independent Variables
  • 12.2 Estimating and Making Inferences about the β Parameters
  • 12.3 Evaluating Overall Model Utility
  • 12.4 Using the Model for Estimation and Prediction
  • PART II: Model Building in Multiple Regression
  • 12.5 Interaction Models
  • 12.6 Quadratic and Other Higher Order Models
  • 12.7 Qualitative (Dummy) Variable Models
  • 12.8 Models with Both Quantitative and Qualitative Variables (Optional)
  • 12.9 Comparing Nested Models (Optional)
  • 12.10 Stepwise Regression (Optional)
  • PART III: Multiple Regression Diagnostics
  • 12.11 Residual Analysis: Checking the Regression Assumptions
  • 12.12 Some Pitfalls: Estimability, Multicollinearity, and Extrapolation

13. Categorical Data Analysis

  • 13.1 Categorical Data and the Multinomial Experiment
  • 13.2 Testing Categorical Probabilities: One-Way Table
  • 13.3 Testing Categorical Probabilities: Two-Way (Contingency) Table
  • 13.4 A Word of Caution about Chi-Square Tests

14. Nonparametric Statistics (available online)

  • 14.1 Introduction: Distribution-Free Tests
  • 14.2 Single-Population Inferences
  • 14.3 Comparing Two Populations: Independent Samples
  • 14.4 Comparing Two Populations: Paired Difference Experiment
  • 14.5 Comparing Three or More Populations: Completely Randomized Design
  • 14.6 Comparing Three or More Populations: Randomized Block Design
  • 14.7 Rank Correlation

APPENDICES

  • A. Summation Notation
  • B. Tables
  • C. Calculation Formulas for Analysis of Variance
  • Short Answers to Selected Odd-Numbered Exercises

    Index

This publication contains markup to enable structural navigation and compatibility with assistive technologies. Images in the publication are fully described. The publication supports text reflow, is screen-reader friendly, and contains no content hazards known to cause adverse physical reactions.

Need help? Get in touch