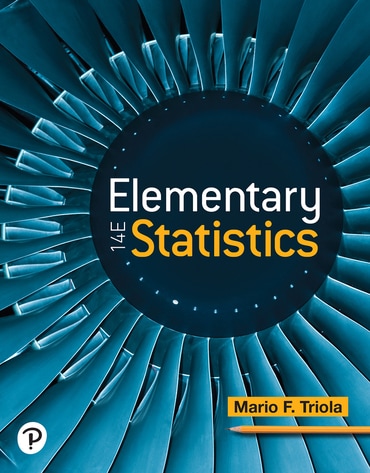
Elementary Statistics, 14th edition

Published by Pearson (July 14, 2021) © 2022

  • Mario F. Triola Dutchess Community College

eTextbook on Pearson+

ISBN-13: 9780137366446 (2021 update)

eTextbook rental includes

  • Instant access to eTextbook
  • Search, highlight, and notes
  • Create flashcards
Products list

Details

  • A print text you can rent
  • Fulfilled by eCampus.com
  • Option to keep after rental expires

Purchasing Instructions

This form contains two groups of radio buttons, one for Exam Pack purchasing options, and one for standard purchasing options. Only one option can be chosen for purchase. Any option that is selected will deselect any previously selected purchase option.

Online exclusive offer

MyLab Statistics with Pearson eText for Elementary Statistics + subscription to Study & Exam Prep

MyLab Statistics with Pearson eText for Elementary Statistics

Platform features

  • Pearson+ eTextbook with study tools
  • Tailored feedback on assignments
  • Interactive course-specific content
  • Real-time analytics and insights
Requires a Course ID, a link from your instructor or an LMS link (Blackboard™, Canvas™, Moodle or D2L®)

In Elementary Statistics, real data brings statistics to life. From cybersecurity to drones and more, statistics shapes the world around us. Acclaimed author Marty Triola offers current applications and abundant new real data to help students of all majors understand the role of statistics in our lives. Updates in the 14th Edition keep this text more relevant and supportive than ever, with a wealth of new data sets, exercises and examples along with larger data sets, content updates and new videos.

1. Introduction to Statistics

  • 1.1 Statistical and Critical Thinking
  • 1.2 Types of Data
  • 1.3 Collecting Sample Data
  • 1.4 Ethics in Statistics (download only)

2. Exploring Data with Tables and Graphs

  • 2.1 Frequency Distributions for Organizing and Summarizing Data
  • 2.2 Histograms
  • 2.3 Graphs That Enlighten and Graphs That Deceive
  • 2.4 Scatterplots, Correlation, and Regression

3. Describing, Exploring, and Comparing Data

  • 3.1 Measures of Center
  • 3.2 Measures of Variation
  • 3.3 Measures of Relative Standing and Boxplots

4. Probability

  • 4.1 Basic Concepts of Probability
  • 4.2 Addition Rule and Multiplication Rule
  • 4.3 Complements, Conditional Probability, and Bayes' Theorem
  • 4.4 Counting
  • 4.5 Simulations for Hypothesis Tests

5. Discrete Probability Distributions

  • 5.1 Probability Distributions
  • 5.2 Binomial Probability Distributions
  • 5.3 Poisson Probability Distributions

6. Normal Probability Distributions

  • 6.1 The Standard Normal Distribution
  • 6.2 Real Applications of Normal Distributions
  • 6.3 Sampling Distributions and Estimators
  • 6.4 The Central Limit Theorem
  • 6.5 Assessing Normality
  • 6.6 Normal as Approximation to Binomial (download only)

7. Estimating Parameters and Determining Sample Sizes

  • 7.1 Estimating a Population Proportion
  • 7.2 Estimating a Population Mean
  • 7.3 Estimating a Population Standard Deviation or Variance
  • 7.4 Bootstrapping: Using Technology for Estimates

8. Hypothesis Testing

  • 8.1 Basics of Hypothesis Testing
  • 8.2 Testing a Claim About a Proportion
  • 8.3 Testing a Claim About a Mean
  • 8.4 Testing a Claim About a Standard Deviation or Variance
  • 8.5 Resampling: Using Technology for Hypothesis Testing

9. Inferences from Two Samples

  • 9.1 Two Proportions
  • 9.2 Two Means: Independent Samples
  • 9.3 Matched Pairs
  • 9.4 Two Variances or Standard Deviations
  • 9.5 Resampling: Using Technology for Inferences

10. Correlation and Regression

  • 10.1 Correlation
  • 10.2 Regression
  • 10.3 Prediction Intervals and Variation 10.4 Multiple Regression
  • 10.5 Nonlinear Regression

11. Goodness-of-Fit and Contingency Tables

  • 11.1 Goodness-of-Fit
  • 11.2 Contingency Tables

12. Analysis of Variance

  • 12.1 One-Way ANOVA
  • 12.2 Two-Way ANOVA

13. Nonparametric Tests

  • 13.1 Basics of Nonparametric Tests
  • 13.2 Sign Test
  • 13.3 Wilcoxon Signed Ranks Test for Matched Pairs
  • 13.4 Wilcoxon Rank-Sum Test for Two Independent Samples
  • 13.5 Kruskal-Wallis Test for Three or More Samples
  • 13.6 Rank Correlation
  • 13.7 Runs Test for Randomness

14. Statistics Process Control

  • 14.1 Control Charts for Variation and Mean
  • 14.2 Control Charts for Attributes

15. Holistic Statistics

APPENDICES

  • A. Tables
  • B. Data Sets
  • C. Websites and Bibliography of Books
  • D. Answers to Odd-Numbered Section Exercises (and all Quick Quizzes, Review Exercises, and Cumulative Review Exercises)

Credits

Index

Index of Applications

This publication contains markup to enable structural navigation and compatibility with assistive technologies. Images in the publication are fully described. The publication supports text reflow, is screen-reader friendly, and contains no content hazards known to cause adverse physical reactions.

Need help? Get in touch