Hey, everyone. So in the last few videos, we've been on this journey of looking at the various graphs of trigonometric functions. We've already seen what the sine and cosine look like, as well as what the secant and cosecant look like. Well, in this video, we're now going to take a look at the graph of the tangent function. If this sounds intimidating, don't sweat it because we're going to learn in this video that just like the cosecant and secant function, the tangent function will also build off of the knowledge that we've already learned about these graphs like the sine and cosine, for example. So without further ado, let's take a look at what some of these problems might look like in this course where we have to deal with the tangent function as a graph.
Now, I want you to recall this identity which we learned about early on that says that the tangent of some value is equal to the sine over the cosine. So, what we can do is use this to graph what the tangent looks like by taking the sine and dividing it by the cosine values. Now I'm going to go ahead and start with 0, and I know that I'm doing this a bit out of order, I'm not starting from the left side this time, but you're going to see why. So if I start with 0, notice that we're going to have at an x value of 0 that our tangent is sine over cosine. Well, that's just going to be 0 divided by 1, which is 0. So that means we're going to start right about there on our graph.
Now, what I'm going to do from here is go to the right and the left on this graph. Start by going to the right at an x value of π4. This is going to give you 22 divided by 22, which is just a value of 1. So π4, we have an output of 1 for our tangent graph. Now if I go to the left, we're going to have negative 22 divided by that same value but positive, and doing this will give you a value of negative one, meaning we're going to be down here on our graph.
Now, what happens if I go to π2 and negative π2 on the x axis? Well, I want you to notice something in both these situations. What we end up having is this case where we have to divide by 0. We're going to have negative one over 0 and one over 0. We learn in math that you cannot divide by 0, so that means that these values are undefined. And because we get undefined values at negative π2 and at π2, that means we're going to have asymptotes show up. So we're going to have an asymptote right about here, and an asymptote right about there. Recall that an asymptote just means the function is approaching infinity at that point. So our graph is going to look something like this. We're going to go down and to the left and up and to the right. So this would be the curve for our tangent function.
There's a couple things you should know about the tangent graph. The tangent graph actually has some similarities to the secant graph, which we saw in the previous video. One of the similarities is that the asymptotes are at the same values on the x axis. Notice how we have asymptotes at negative 3 π2, negative π2, π2, and 3 π2. Well, for our tangent graph, we can see these asymptotes are the same. And it turns out that for the tangent graph, all of the asymptotes or places where the curve repeats are going to be when the cosine of x is equal to 0, which is going to be at odd multiples of π2. So because of this, on our tangent graph, we're going to see another asymptote at negative 3 π2, and an asymptote at positive 3 π2.
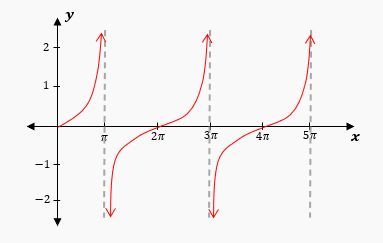
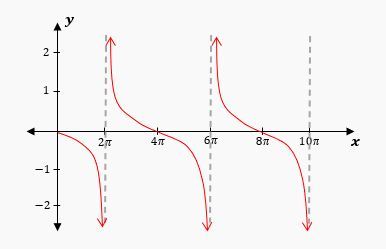
Now, the way that the tangent graph is different than the secant graph is, well, obviously this curve is different, but it turns out that for the tangent graph, the period of only π. Right? For the secent graph, we can see what happens from here to there on the x-axis, which would be 2 π. Well, it turns out that the tangent graph will actually repeat every π units. So rather than getting some kind of different curve, you're going to get the same curve right about here, and you're going to get this same curve right about there. So every time you travel a distance of π on the x axis, you're going to get your curve repeating. And what this does is actually changes the period for the tangent. So in the past, we've seen that the period for the sine, cosine, cosecant, and secant is 2πb. Well, it turns out when dealing with the tangent, the period is only πb. So that's something you have to watch out for when dealing with the tangent graph. But the nice thing about the tangent graph is that all of the same transformation rules apply that have been used for sine and cosine aside from the period change.
Now to make sure that we're understanding this, let's try an example where we have to graph the function y = tan π2x. First, figure out the period of our graph. Well, recall that the period for the tangent, as we just learned, is πb, rather than 2πb. The b value is what we have in front of the x, so we're going to have π divided by π2. Now, what I can do is take this fraction we have in the denominator and flip it and bring it to the numerator. So I can flip this right here, and we're going to get 2 π divided by π, because this will stay in the denominator, and then those π's are going to cancel giving us a period of 2. So if our period is 2, that means that every 2 units, we're going to have our curve repeat. So what I'm going to do is label the x-axis like this. We're going to say that we have points here, 1, 2, 3 on the x-axis, and then we have negative 1, negative 2, and negative 3. Now we've learned how the tangent graph starts right here at the middle, and then it curves up into the right and down into the left. And we also know that this tangent graph is going to have a period of 2. So what I can do is draw asymptotes here at negative one, and I can draw another asymptote at positive one, because this would be a period of 2 on the x-axis. So what I can do is draw a curve that looks something like this.
So this would be the tangent graph. Now because the period is 2, if I start here where this asymptote is and go 2 units to the right, we're going to have another asymptote at positive 3. And if I go to negative one, we can go 2 units to the left and get another asymptote at negative 3. And this curve is going to repeat between each of these asymptotes, so we're going to get the same curve right about there and the same curve back here. This is what the graph would look like, and that is the solution to the problem. So hopefully this gives you a better understanding of how to work with graphs when you're dealing with the tangent function. Thanks for watching, and please let me know if you have any questions.


