4. Graphing Trigonometric Functions
Graphs of the Sine and Cosine Functions
4. Graphing Trigonometric Functions
Graphs of the Sine and Cosine Functions: Study with Video Lessons, Practice Problems & Examples
69PRACTICE PROBLEM
Write an equation that represents the graph shown. The equation should be in simplest form ( and phase shift is not included).
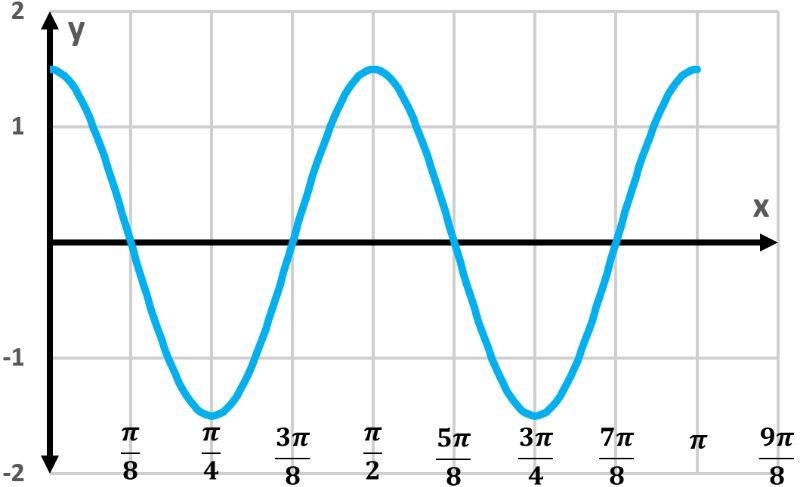
Write an equation that represents the graph shown. The equation should be in simplest form ( and phase shift is not included).