4. Graphing Trigonometric Functions
Graphs of the Sine and Cosine Functions
4. Graphing Trigonometric Functions
Graphs of the Sine and Cosine Functions: Study with Video Lessons, Practice Problems & Examples
58PRACTICE PROBLEM
If the trigonometric function shown has the possible forms of , , , or , what is the equation that represents the graph? Note that c should have the smallest possible positive value.
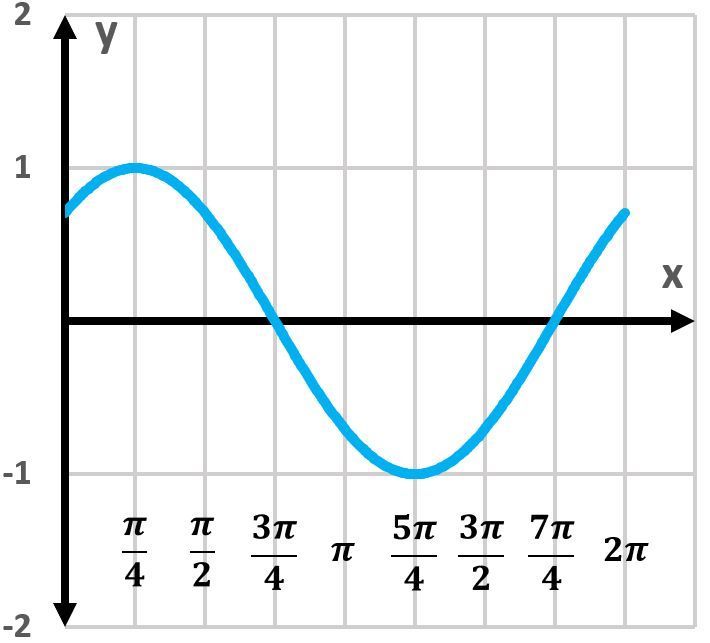
If the trigonometric function shown has the possible forms of , , , or , what is the equation that represents the graph? Note that c should have the smallest possible positive value.