4. Graphing Trigonometric Functions
Graphs of the Sine and Cosine Functions
Problem 53a
Textbook Question
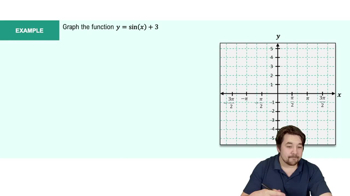
In Exercises 53–60, use a vertical shift to graph one period of the function. y = sin x + 2
 Verified step by step guidance
1
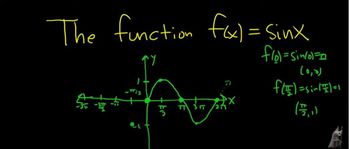
Identify the base function: The base function here is \( y = \sin x \).
Determine the vertical shift: The function \( y = \sin x + 2 \) indicates a vertical shift of 2 units upwards.
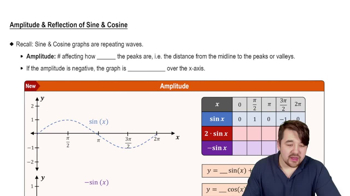
Graph the base function: Start by sketching the graph of \( y = \sin x \), which has a period of \( 2\pi \), an amplitude of 1, and oscillates between -1 and 1.
Apply the vertical shift: Shift the entire graph of \( y = \sin x \) upwards by 2 units. This means the new range of the function will be from 1 to 3.
Label key points: Mark the key points on the graph, such as the maximum, minimum, and intercepts, to reflect the vertical shift. For example, the maximum point at \( (\pi/2, 1) \) becomes \( (\pi/2, 3) \).
Recommended similar problem, with video answer:
Verified SolutionThis video solution was recommended by our tutors as helpful for the problem above
Video duration:
4mWas this helpful?
Key Concepts
Here are the essential concepts you must grasp in order to answer the question correctly.
Sine Function
The sine function, denoted as sin(x), is a periodic function that oscillates between -1 and 1. It represents the y-coordinate of a point on the unit circle as it rotates around the origin. Understanding its basic properties, such as amplitude, period, and phase shift, is essential for graphing transformations of the sine function.
Recommended video:

 5:53
5:53Graph of Sine and Cosine Function
Vertical Shift
A vertical shift involves moving the entire graph of a function up or down along the y-axis. For the function y = sin(x) + 2, the '+2' indicates a vertical shift of 2 units upward. This transformation affects the range of the function, changing it from [-1, 1] to [1, 3] for one period of the sine wave.
Recommended video:
 6:31
6:31Phase Shifts
Graphing Transformations
Graphing transformations involve altering the basic shape of a function through shifts, stretches, or reflections. In the case of y = sin(x) + 2, recognizing how vertical shifts affect the graph is crucial. By understanding these transformations, one can accurately sketch the modified sine wave and predict its behavior over one period.
Recommended video:
 5:25
5:25Introduction to Transformations
 5:53m
5:53mWatch next
Master Graph of Sine and Cosine Function with a bite sized video explanation from Nick Kaneko
Start learningRelated Videos
Related Practice