4. Graphing Trigonometric Functions
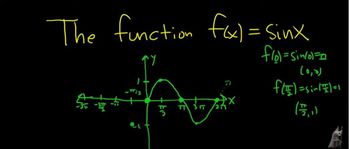
Graphs of the Sine and Cosine Functions
Problem 4.51
Textbook Question
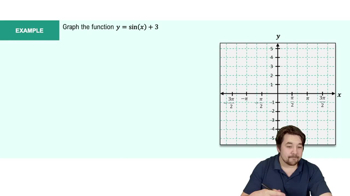
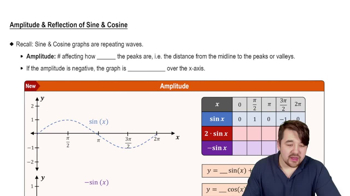
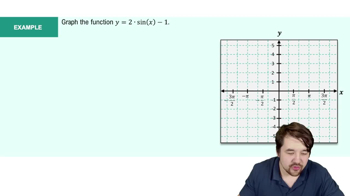
Textbook QuestionGraph each function over a two-period interval. See Example 4.
y = -3 + 2 sin x
 Verified Solution
This video solution was recommended by our tutors as helpful for the problem above
Video duration:
0m:0s130
views
Was this helpful?
Related Videos
Related Practice

 5:53
5:53


Showing 1 of 22 videos