4. Graphing Trigonometric Functions
Graphs of the Sine and Cosine Functions
Problem 4.51
Textbook Question
Graph each function over a two-period interval. See Example 4.
y = -3 + 2 sin x
 Verified step by step guidance
1
Identify the basic form of the sine function: \( y = a + b \sin(x) \), where \( a = -3 \) and \( b = 2 \).
Determine the amplitude of the function, which is the absolute value of \( b \). In this case, the amplitude is \( |2| = 2 \).
Identify the vertical shift, which is given by \( a = -3 \). This means the entire graph is shifted down by 3 units.
Determine the period of the sine function. The standard period of \( \sin(x) \) is \( 2\pi \). Since there is no horizontal stretch or compression, the period remains \( 2\pi \).
Graph the function over a two-period interval \([0, 4\pi]\), starting with the midline at \( y = -3 \), and plot the sine wave with an amplitude of 2, ensuring it completes two full cycles within this interval.
Recommended similar problem, with video answer:
Verified SolutionThis video solution was recommended by our tutors as helpful for the problem above
Video duration:
0m:0sWas this helpful?
Key Concepts
Here are the essential concepts you must grasp in order to answer the question correctly.
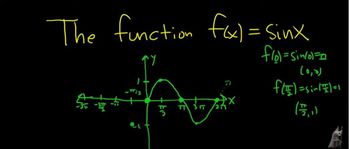
Sine Function
The sine function, denoted as sin(x), is a periodic function that oscillates between -1 and 1. It represents the y-coordinate of a point on the unit circle as it rotates around the origin. Understanding its periodic nature is crucial for graphing, as it repeats every 2π radians.
Recommended video:

 5:53
5:53Graph of Sine and Cosine Function
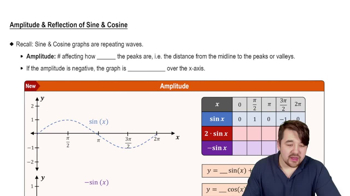
Amplitude and Vertical Shift
The amplitude of a sine function indicates the height of its peaks and is determined by the coefficient in front of the sine term. In the function y = -3 + 2 sin x, the amplitude is 2, meaning the graph will oscillate 2 units above and below its midline. The vertical shift, represented by the constant term (-3), moves the entire graph down by 3 units.
Recommended video:
 6:31
6:31Phase Shifts
Graphing Periodic Functions
Graphing periodic functions involves plotting their values over a specified interval, typically one or more complete cycles. For the function y = -3 + 2 sin x, one complete cycle occurs over the interval [0, 2π]. To graph it over a two-period interval, you would extend the graph from 0 to 4π, ensuring to mark key points such as maximum, minimum, and midline crossings.
Recommended video:
 5:33
5:33Period of Sine and Cosine Functions
 5:53m
5:53mWatch next
Master Graph of Sine and Cosine Function with a bite sized video explanation from Nick Kaneko
Start learningRelated Videos
Related Practice