Skip to main content
Trigonometry
My Course
Learn
Exam Prep
AI Tutor
Study Guides
Flashcards
Explore
My Course
Learn
Exam Prep
AI Tutor
Study Guides
Flashcards
Explore
?
Select textbook and Institution
Improve your experience by picking them
Table of contents
Skip topic navigation
0. Review of College Algebra
4h 45m
Chapter worksheet
Rationalizing Denominators
17m
Pythagorean Theorem & Basics of Triangles
17m
Basics of Graphing
30m
Functions
41m
Transformations
45m
Asymptotes
4m
Solving Linear Equations
31m
Solving Quadratic Equations
55m
Complex Numbers
41m
1. Measuring Angles
40m
Chapter worksheet
Angles in Standard Position
12m
Coterminal Angles
8m
Complementary and Supplementary Angles
10m
Radians
8m
2. Trigonometric Functions on Right Triangles
2h 5m
Chapter worksheet
Trigonometric Functions on Right Triangles
45m
Special Right Triangles
30m
Cofunctions of Complementary Angles
26m
Solving Right Triangles
23m
3. Unit Circle
1h 19m
Chapter worksheet
Defining the Unit Circle
14m
Trigonometric Functions on the Unit Circle
9m
Common Values of Sine, Cosine, & Tangent
11m
Reference Angles
38m
Reciprocal Trigonometric Functions on the Unit Circle
6m
4. Graphing Trigonometric Functions
1h 19m
Chapter worksheet
Graphs of the Sine and Cosine Functions
32m
Phase Shifts
14m
Graphs of Secant and Cosecant Functions
10m
Graphs of Tangent and Cotangent Functions
21m
5. Inverse Trigonometric Functions and Basic Trigonometric Equations
1h 41m
Chapter worksheet
Inverse Sine, Cosine, & Tangent
28m
Evaluate Composite Trig Functions
44m
Linear Trigonometric Equations
28m
6. Trigonometric Identities and More Equations
2h 34m
Chapter worksheet
Introduction to Trigonometric Identities
1h 4m
Sum and Difference Identities
1h 3m
Double Angle Identities
16m
Solving Trigonometric Equations Using Identities
9m
7. Non-Right Triangles
1h 38m
Chapter worksheet
Law of Sines
49m
Law of Cosines
30m
Area of SAS & ASA Triangles
19m
8. Vectors
2h 25m
Chapter worksheet
Geometric Vectors
28m
Vectors in Component Form
32m
Direction of a Vector
23m
Unit Vectors and i & j Notation
27m
Dot Product
22m
Cross Product
11m
9. Polar Equations
2h 5m
Chapter worksheet
Polar Coordinate System
29m
Convert Points Between Polar and Rectangular Coordinates
26m
Convert Equations Between Polar and Rectangular Forms
29m
Graphing Other Common Polar Equations
39m
10. Parametric Equations
1h 6m
Chapter worksheet
Graphing Parametric Equations
12m
Eliminate the Parameter
32m
Writing Parametric Equations
21m
11. Graphing Complex Numbers
1h 7m
Chapter worksheet
Graphing Complex Numbers
6m
Polar Form of Complex Numbers
22m
Products and Quotients of Complex Numbers
14m
Powers of Complex Numbers (DeMoivre's Theorem)
23m
0. Review of College Algebra
Functions
Trigonometry
0. Review of College Algebra
Functions
Previous video
Next video
Struggling with Trigonometry?
Join thousands of students who trust us to help them ace their exams!
Watch the first video
Finding the Domain and Range of a Graph
Nick Kaneko
Video duration:
5m
Play a video:
Previous video
Next video
Related Videos
Related Practice
5:20
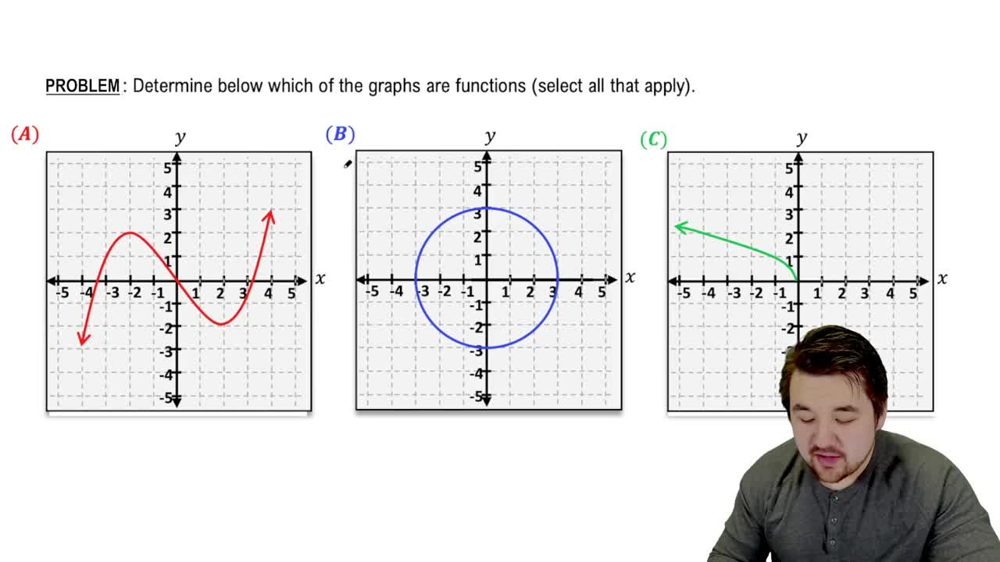
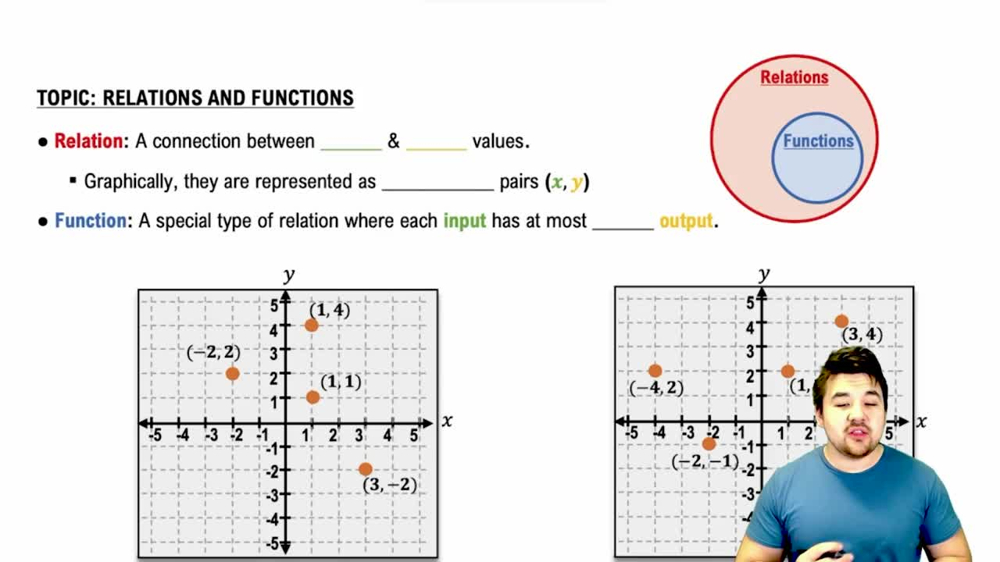
Introduction to Relations and Functions
728
views
8
rank
1:30
Example 1
545
views
5
rank
5:38
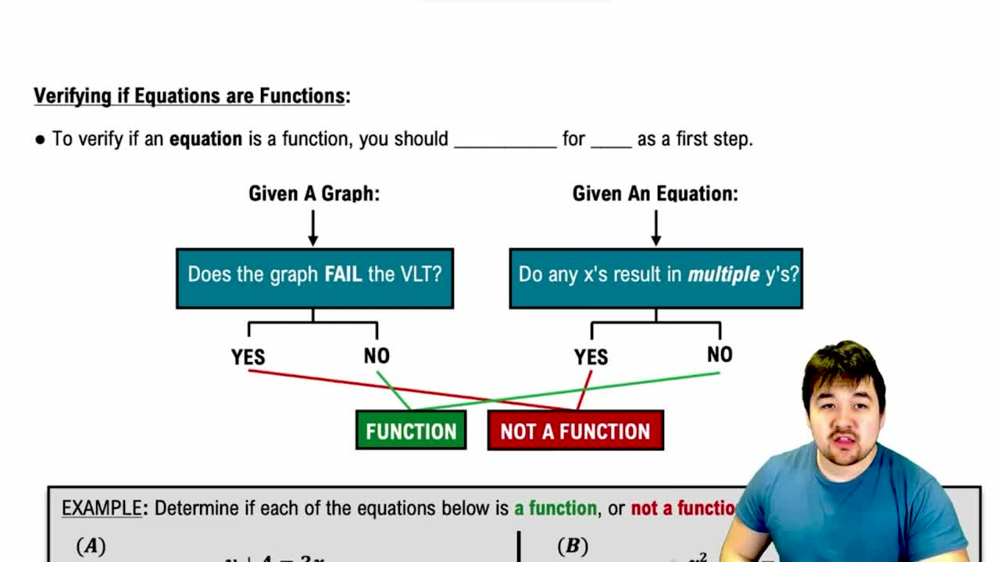
Verifying Equations as Functions
537
views
6
rank
1
comments
3:43
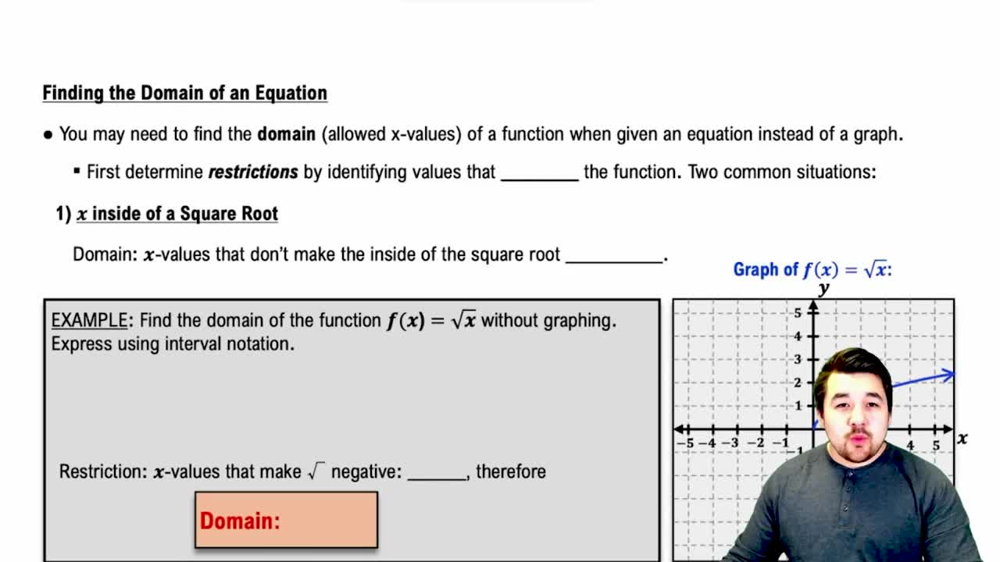
Finding the Domain of an Equation
500
views
6
rank
5:57
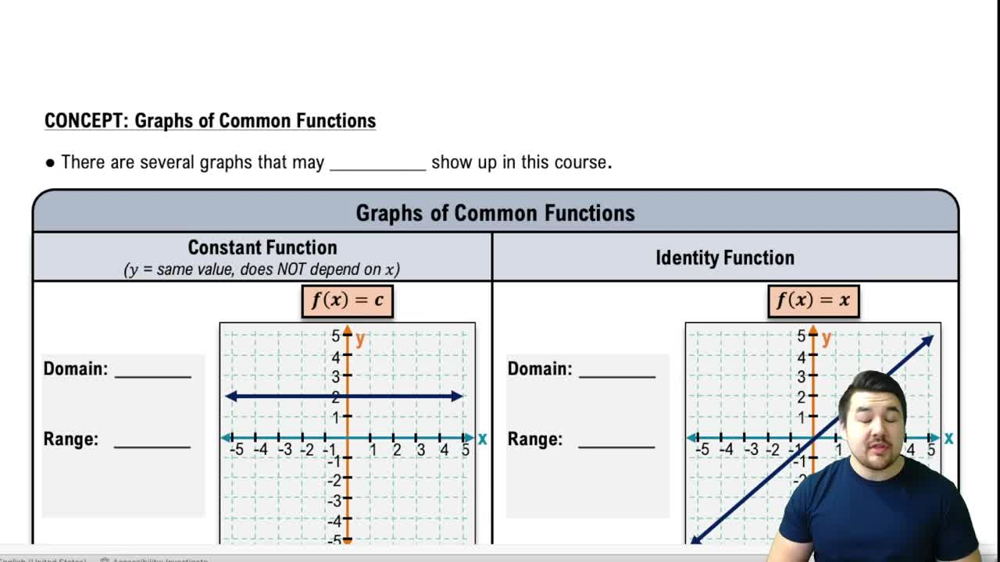
Graphs of Common Functions
506
views
5
rank
Show more videos


 5:20
5:20