4. Graphing Trigonometric Functions
Graphs of the Sine and Cosine Functions
Problem 23b
Textbook Question
Graph each function. See Examples 1 and 2. ƒ(x) = -½ x²
 Verified step by step guidance
1
Identify the type of function: The given function \( f(x) = -\frac{1}{2}x^2 \) is a quadratic function, which is a parabola.
Determine the direction of the parabola: Since the coefficient of \( x^2 \) is negative (\(-\frac{1}{2}\)), the parabola opens downwards.
Find the vertex of the parabola: For the function \( f(x) = ax^2 + bx + c \), the vertex is at \( x = -\frac{b}{2a} \). Here, \( a = -\frac{1}{2} \), \( b = 0 \), so the vertex is at \( x = 0 \). Substitute \( x = 0 \) into the function to find \( f(0) = 0 \). Thus, the vertex is at \( (0, 0) \).
Determine the axis of symmetry: The axis of symmetry for a parabola \( ax^2 + bx + c \) is the vertical line \( x = -\frac{b}{2a} \). Here, it is \( x = 0 \).
Plot additional points: Choose values for \( x \) to find corresponding \( f(x) \) values. For example, if \( x = 1 \), then \( f(1) = -\frac{1}{2}(1)^2 = -\frac{1}{2} \). Similarly, find \( f(-1) \). Plot these points and sketch the parabola.
Recommended similar problem, with video answer:
Verified SolutionThis video solution was recommended by our tutors as helpful for the problem above
Video duration:
6mWas this helpful?
Key Concepts
Here are the essential concepts you must grasp in order to answer the question correctly.
Quadratic Functions
A quadratic function is a polynomial function of degree two, typically expressed in the form ƒ(x) = ax² + bx + c. The graph of a quadratic function is a parabola, which can open upwards or downwards depending on the sign of the coefficient 'a'. In this case, since 'a' is negative (-½), the parabola opens downwards, indicating that it has a maximum point.
Recommended video:

 6:36
6:36Quadratic Formula
Vertex of a Parabola
The vertex of a parabola is the highest or lowest point on the graph, depending on its orientation. For the function ƒ(x) = -½ x², the vertex is located at the origin (0,0) because there are no linear or constant terms to shift it. The vertex serves as a critical point for understanding the function's maximum value and the symmetry of the graph.
Recommended video:
 04:31
04:31Eliminating the Parameter Example 1
Graphing Techniques
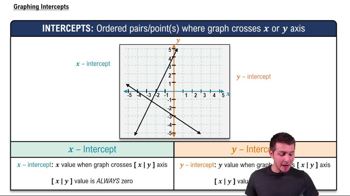
Graphing a quadratic function involves plotting key points, including the vertex and intercepts. For ƒ(x) = -½ x², the y-intercept occurs at (0,0), and the x-intercepts can be found by setting the function equal to zero. Additionally, symmetry about the vertex helps in sketching the parabola accurately, allowing for a clear representation of the function's behavior.
Recommended video:
 4:08
4:08Graphing Intercepts
 5:53m
5:53mWatch next
Master Graph of Sine and Cosine Function with a bite sized video explanation from Nick Kaneko
Start learningRelated Videos
Related Practice