Graph each function over a one-period interval. y = 1 - (1/2) csc (x - 3π/4)
Verified step by step guidance
1
Identify the basic form of the cosecant function: \( y = a + b \cdot \csc(c(x - d)) \). In this case, \( a = 1 \), \( b = -\frac{1}{2} \), \( c = 1 \), and \( d = \frac{3\pi}{4} \).
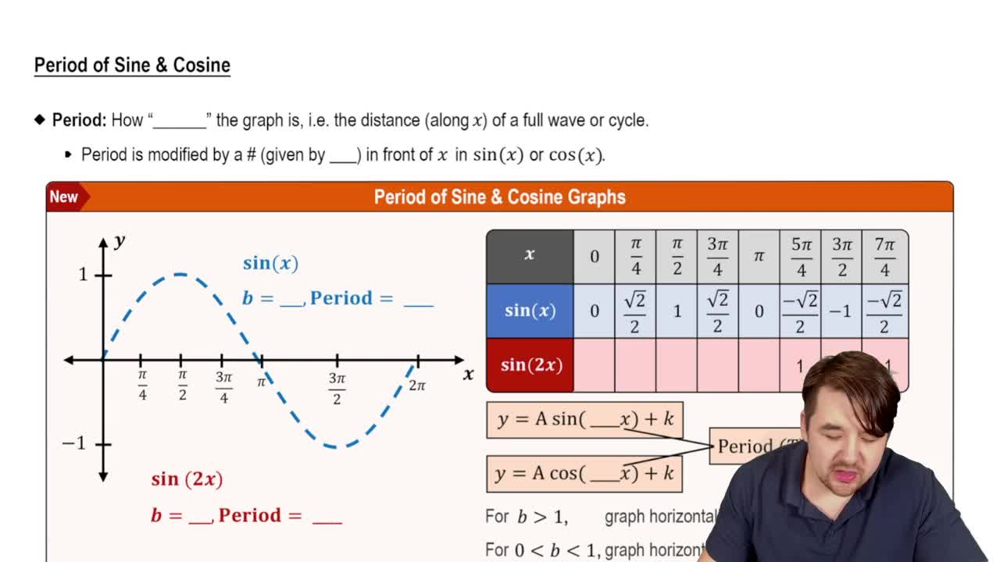
Determine the period of the function. The period of \( \csc(x) \) is \( 2\pi \), so the period of \( \csc(c(x - d)) \) is \( \frac{2\pi}{c} = 2\pi \).
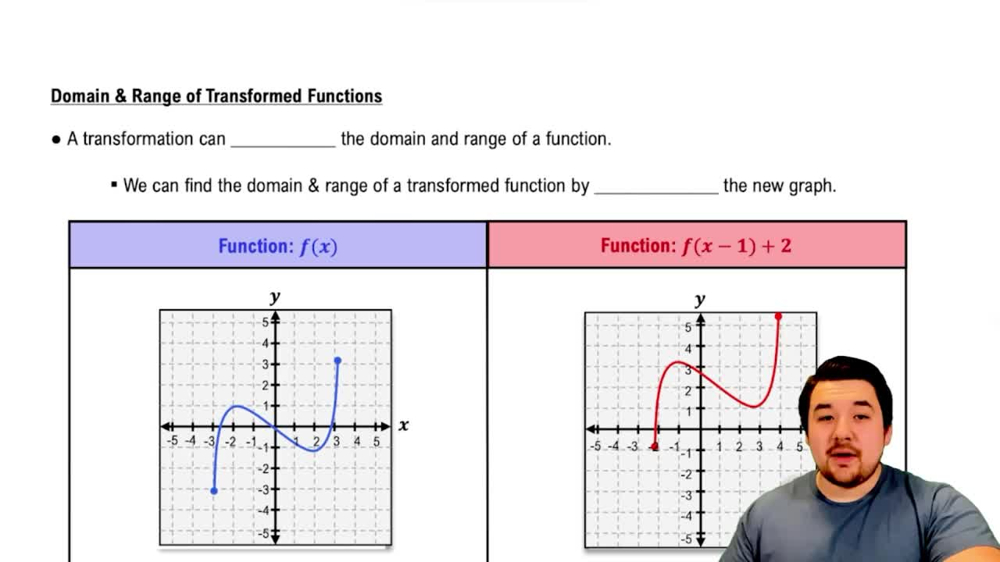
Identify the phase shift, which is determined by \( d \). The function is shifted to the right by \( \frac{3\pi}{4} \).
Determine the vertical shift and reflection. The function is shifted up by 1 unit and reflected vertically due to the negative sign in front of \( \frac{1}{2} \).
Graph the function by plotting key points and asymptotes over one period, considering the transformations: vertical shift, reflection, and phase shift.
Verified video answer for a similar problem:
This video solution was recommended by our tutors as helpful for the problem above
Play a video:
0 Comments
Key Concepts
Here are the essential concepts you must grasp in order to answer the question correctly.
Cosecant Function
The cosecant function, denoted as csc(x), is the reciprocal of the sine function. It is defined as csc(x) = 1/sin(x). The cosecant function has a range of all real numbers except for the interval (-1, 1) and is undefined where sin(x) = 0. Understanding its properties, including its vertical asymptotes and periodicity, is essential for graphing functions involving csc.
Transformations of functions involve shifting, stretching, compressing, or reflecting the graph of a function. In the given function, y = 1 - (1/2) csc(x - 3π/4), the term (x - 3π/4) indicates a horizontal shift to the right by 3π/4, while the coefficient -1/2 affects the vertical stretch and reflection. Recognizing these transformations is crucial for accurately graphing the function.
The period of a trigonometric function is the length of one complete cycle of the function. For the cosecant function, the standard period is 2π. However, transformations can alter the period; in this case, since there are no horizontal scaling factors, the period remains 2π. Understanding the period helps in determining the intervals over which to graph the function accurately.

 Verified step by step guidance
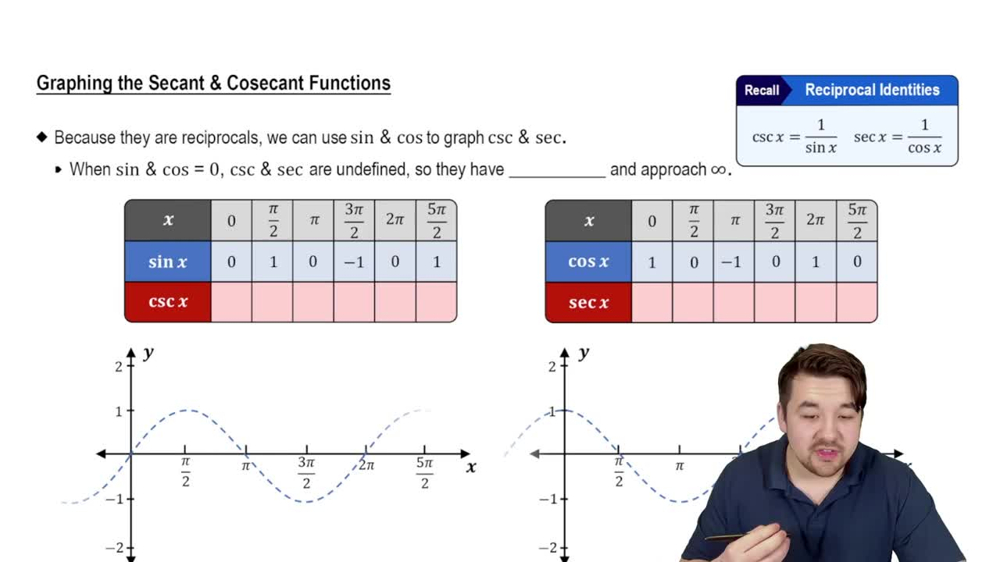
 6:22
6:22